
GULF ISLANDS · NATIONAL SEASHORE · THE 12-MONTH VERDICT
Between January and July the average afternoon on this stretch of the Gulf climbs 27.8°F, from 63.1 to 90.9, and the water makes a 25.5°F swing of its own, from 60.4 to 85.9. A barrier island in February and the same island in July are not the same trip, and no packing list fixes the difference.
Most visitors show up in the hottest, wettest weeks of the year. August alone averages 6.08 inches of rain spread over 8.1 days that reach a tenth of an inch. October, the month this guide ends up recommending, averages 2.82 inches over 3.5 such days, with the Gulf still at 78.9°F, warmer than May’s 78.2°F.
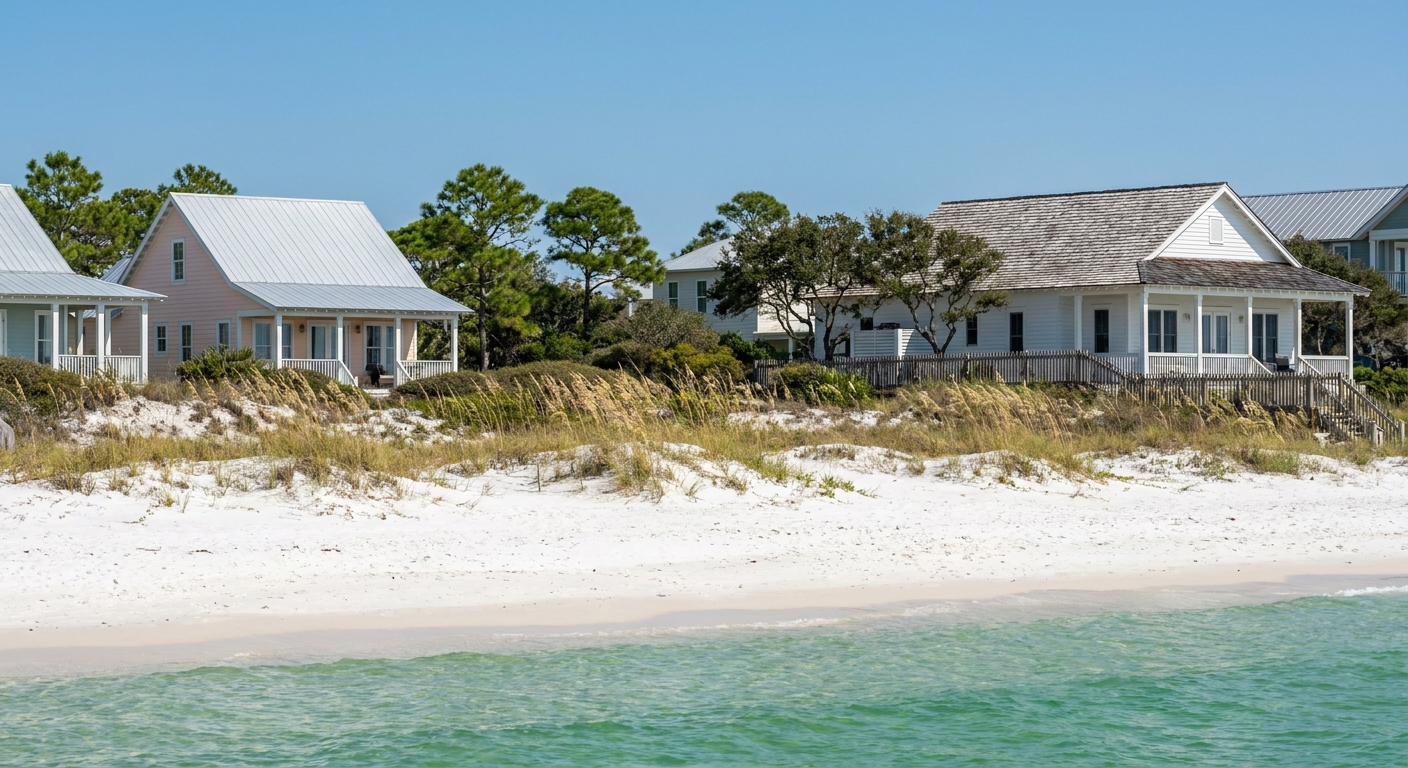
THE YEAR AT A GLANCE · GULF ISLANDS
Go in October: 80.9°F afternoons, the driest total of the twelve months at 2.82 inches, and Gulf water still at 78.9°F, warmer than it is in May.
BEST MONTH: OCTOBER · SWIM WINDOW: MAY–OCTOBER · HARDEST: AUGUST · QUIET: DECEMBER–EARLY FEBRUARY
Go for: October and May, when the water clears 78°F and rain totals stay under 3.25 inches for the month.
Think twice before: tent camping in August: 6.08 inches of rain, 8.1 wet days and nights that only fall to 75.8°F.
Air normals: NOAA NCEI 1991–2020, South Walton station · Sea: Open-Meteo Marine, 2015–2024 · full sources at the end
On this page
- The single best monthOctober: 80.9°F days, 2.82 inches of rain
- Sea temperature month by monthSix months above 78°F, May to October
- Highs, lows and rain for all twelve monthsThe full table, plus where the thermometer sits
- The quietest weeks on the sandDecember to early February, at 60.4°F water
- Which month to avoid with childrenAugust, and why July is the lesser evil
- Is April or November worth booking?April water at 71.0°F, November at 72.4°F
The seashore is a chain rather than a beach: Fort Pickens and Perdido Key on the Florida side, Davis Bayou and the boat-only barrier islands off Mississippi. Timing splits along the same line. The Florida units sit a short drive from Pensacola and work on any dry morning, while the Mississippi islands need a boat, so wind counts there as much as rain does. If you are sorting this park against the state’s others, our Florida parks guide lines them up.
Gulf Islands National Seashore weather month by month: highs, lows, rain and sea
| Month | Avg high | Avg low | Rain | Days ≥0.10 in | Sea (avg daily max) |
|---|---|---|---|---|---|
| January | 63.1°F | 45.3°F | 4.52 in | 5.6 | 60.4°F |
| February | 65.8°F | 47.9°F | 4.96 in | 5.3 | 62.1°F |
| March | 70.7°F | 53.6°F | 4.70 in | 5.2 | 67.5°F |
| April | 76.2°F | 60.1°F | 4.55 in | 4.0 | 71.0°F |
| May | 83.5°F | 68.0°F | 3.22 in | 3.7 | 78.2°F |
| June | 88.9°F | 74.1°F | 4.70 in | 6.1 | 82.9°F |
| July | 90.9°F | 76.2°F | 5.77 in | 7.2 | 85.9°F |
| August | 90.6°F | 75.8°F | 6.08 in | 8.1 | 87.8°F |
| September | 88.5°F | 72.4°F | 5.18 in | 5.3 | 85.9°F |
| October | 80.9°F | 63.2°F | 2.82 in | 3.5 | 78.9°F |
| November | 72.1°F | 53.0°F | 4.13 in | 4.3 | 72.4°F |
| December | 65.6°F | 47.5°F | 4.72 in | 6.5 | 65.9°F |
Five months in a row average highs of 83.5°F or better, from May through September, and then the year falls off a cliff: October runs 7.6°F cooler than September, November another 8.8°F cooler than October. Rain does not follow the same curve. The two driest totals of the twelve months sit on either side of the heat, 2.82 inches in October and 3.22 in May, while the wettest, 6.08 inches, lands in August when the beach is busiest.
Two months do the actual switching. April to May lifts the water 7.2°F, from 71.0 to 78.2, and the air 7.3°F, from 76.2 to 83.5, which is the difference between a wetsuit thought and a swimsuit. September to October cuts rainfall by 2.36 inches, from 5.18 to 2.82, and trims wet days from 5.3 to 3.5, while the Gulf gives up 7.0°F and still reads 78.9.
August is the hard one, and it is hardest for campers. It records the wettest ground of the twelve months, 6.08 inches of it, over 8.1 days at a tenth of an inch or more, of which 1.8 days deliver a full inch. Overnight lows average 75.8°F, so a tent at Fort Pickens never really cools, and the sea at 87.8°F is too warm to work as relief. Day visitors with a car and a cooler feel far less of this than anyone sleeping outside.
Every figure here for air and rain comes from NOAA’s 1991–2020 normals recorded at the Panhandle station at South Walton, and the seashore reaches 160 miles west of that gauge into Mississippi, so these numbers describe its eastern end rather than the whole park. The wet-day counts use the American thresholds of 0.10 inch and 1.00 inch, not millimeters. Sea temperatures are a separate source: Open-Meteo’s marine model, averaged 2015–2024.
When is the best time to visit Gulf Islands National Seashore?
October, and it is not close. Afternoons average 80.9°F, nights 63.2°F, rainfall totals the year’s lowest at 2.82 inches over 3.5 days reaching a tenth of an inch, and the Gulf still measures 78.9°F. No other month on the table puts those four readings on the same line. Daylight on October 15 runs 11 hours 28 minutes, enough for a morning on the sand and an afternoon on the dune trails.
Its neighbors both cost you something measurable. September keeps the warmer sea, 85.9°F, but brings 5.18 inches of rain, nearly twice October’s total, with afternoons 7.6°F hotter. November drops the water to 72.4°F, 6.5°F below October, adds 1.31 inches of rain, and shortens the day to 10 hours 39 minutes, 49 minutes less than mid-October.
For how that October window fits the rest of the state, including the wet season and the hurricane calendar that this station’s normals say nothing about, see our Florida month-by-month verdict. The beaches around the weather station itself get their own treatment in the South Walton guide.
When can you swim in Gulf Islands National Seashore? Sea temperature month by month
Six months clear 78°F, the point at which most swimmers stop thinking about the water at all: May at 78.2, June at 82.9, July at 85.9, August at 87.8, September at 85.9 and October at 78.9. April and November sit in bracing territory, 71.0°F and 72.4°F. From December through March the Gulf reads 65.9, 60.4, 62.1 and 67.5, cold enough that a January swim is a dare rather than a plan.
One caveat on those figures. Each is an average of daily maxima over 2015 to 2024, not a 24-hour mean, so it describes the warmest point of an average day and runs a shade above what a 7 a.m. swimmer meets. It is also modeled offshore water on a ten-year window, while the air normals beside it come from a gauge on land over thirty years. Treat the two columns as neighbors, not as one measurement.
When is Gulf Islands National Seashore quietest?
The calendar answers this better than any price chart. Crowds follow school holidays and warm water, so the thin weeks run from the start of December to the beginning of February, with the Christmas and New Year fortnight cutting a busy notch in the middle. Both bookend months read low on the table: December gives 10 hours 15 minutes of daylight on the 15th, the shortest of the year, and January’s water bottoms out at 60.4°F.
What you get for that is the beach itself, uncontested, at 63.1°F in January and 65.8°F in February, which is walking weather rather than lying-down weather. Winter is also when the sand gets its birds back and when a whole dune trail can go by without another car in the lot. February takes the cold edge off, too: 1.0 night at or below freezing against January’s 3.2.
What you give up is specific. Swimming is off, at 60.4°F. December is wet in a grinding way, 4.72 inches across 6.5 days at a tenth of an inch or more, and the sun sets early enough that a late start wastes the trip. Boat service to the Mississippi islands and the ranger programs run on their own winter schedules, so confirm with the park before you drive; the practicalities guide covers the rest of the off-season admin.
Which month should you avoid in Gulf Islands National Seashore?
August, for campers and for families with small children. It carries the year’s heaviest rainfall, 6.08 inches, the most wet days, 8.1, and the most inch-plus soakings, 1.8, on top of afternoons at 90.6°F and nights that stall at 75.8°F. July is barely cooler by day, 90.9°F, yet it delivers 0.31 inch less rain and one fewer wet day, which is why the lesser evil of the two is the hotter one. Families weighing the whole state will find the same logic in our Florida with kids guide.
August still buys things nothing else does. The Gulf hits 87.8°F, the warmest of the twelve months, which turns a two-hour swim into a non-event for kids who chill fast. Mid-August still gives 13 hours 16 minutes of daylight. And those 8.1 wet days leave roughly 23 August days that never record even a tenth of an inch, so the odds on any single beach morning are better than the monthly total suggests.
Is the shoulder season worth it in Gulf Islands National Seashore?
The shoulders here are April, May and November, and each undercuts high summer by a measurable amount. April runs 12.7°F cooler than June by day, 76.2°F against 88.9. May’s 3.22 inches of rain is 2.86 inches less than August’s 6.08. November posts 4.3 wet days where August posts 8.1, close to half.
May is the one that gives most. It is the second-driest month of the year, 3.22 inches over 3.7 wet days, with 13 hours 45 minutes of daylight on the 15th and water already at 78.2°F. Its nights average 68.0°F, a full 8.2°F cooler than July’s 76.2, which is the single number that decides whether a tent is pleasant or punishing.
The bill comes in water and light. April’s sea at 71.0°F sits 14.9°F below July’s 85.9, cold enough that plenty of swimmers stay ankle-deep. November’s day on the 15th lasts 10 hours 39 minutes, 3 hours 29 minutes shorter than mid-June, and its nights drop to 53.0°F. Neither month gives you the long, warm evening that summer trades its rain for.
So: take May if you came to swim, October if you came to be dry and warm, and treat November as a walking and birding month rather than a beach one. April only makes sense for travelers who are happy to wade at 71.0°F, and it comes with 4.55 inches of rain, well over October’s total. If the visit is one leg of a longer drive, the Florida road trip guide sets the same window against the rest of the coast.
The last word
Book October, take the Fort Pickens side if you want to arrive by car, and keep one thing in view: dry does not mean gentle. Of October’s 3.5 wet days, 1.1 deliver a full inch, so the month’s rain arrives in a couple of hard shots rather than a drizzle, and a beach day washed out here tends to be washed out in one hour. Pack the rain shell you would not bother with in May, and plan the Mississippi boat trip for the first clear morning of the stay rather than the last.
Sources & data for this guide
- Monthly air normals, rain totals, wet-day counts (0.10 in and 1.00 in) and freezing nights · NOAA NCEI, 1991–2020 monthly normals, station USW00053853, South Walton, Florida Panhandle · checked Sep 12, 2026
- Sea surface temperatures, given as the mean of daily maxima · Open-Meteo Marine API, 2015–2024 average · checked Sep 12, 2026
- Daylight length and sunrise/sunset on the 15th of each month · sunrise-sunset.org · checked Sep 12, 2026
- Editorial admission: no station reading covering the Mississippi units was available to us, so the table describes the seashore’s eastern end, 160 miles east of its western islands. We could not verify conditions on Ship Island from primary data and have not guessed at them.
- Park unit names, boat access and seasonal programs are editorial orientation; schedules and closures change · confirm with the National Park Service before you travel.