
GULF ISLANDS NATIONAL SEASHORE · JUNE · THE MONTH GUIDE
June brings the seashore its warm-water season: the Gulf averages 82.9°F at its daily peak, and on the 15th the sun stays up until 7:49 pm. The trade-off comes in the air. NOAA station normals put the average June afternoon at 88.9°F, and hurricane season opened on June 1, as our Florida guide sets out from National Hurricane Center dates.
For a June vacation, two or three nights around one section of the seashore make sense. It runs 160 miles from the Florida Panhandle into Mississippi, and hopping between units uses up beach time. Airports and routes are in our Florida flights guide, and bases are in where to stay in Florida. June is set against May and July below, figure for figure.
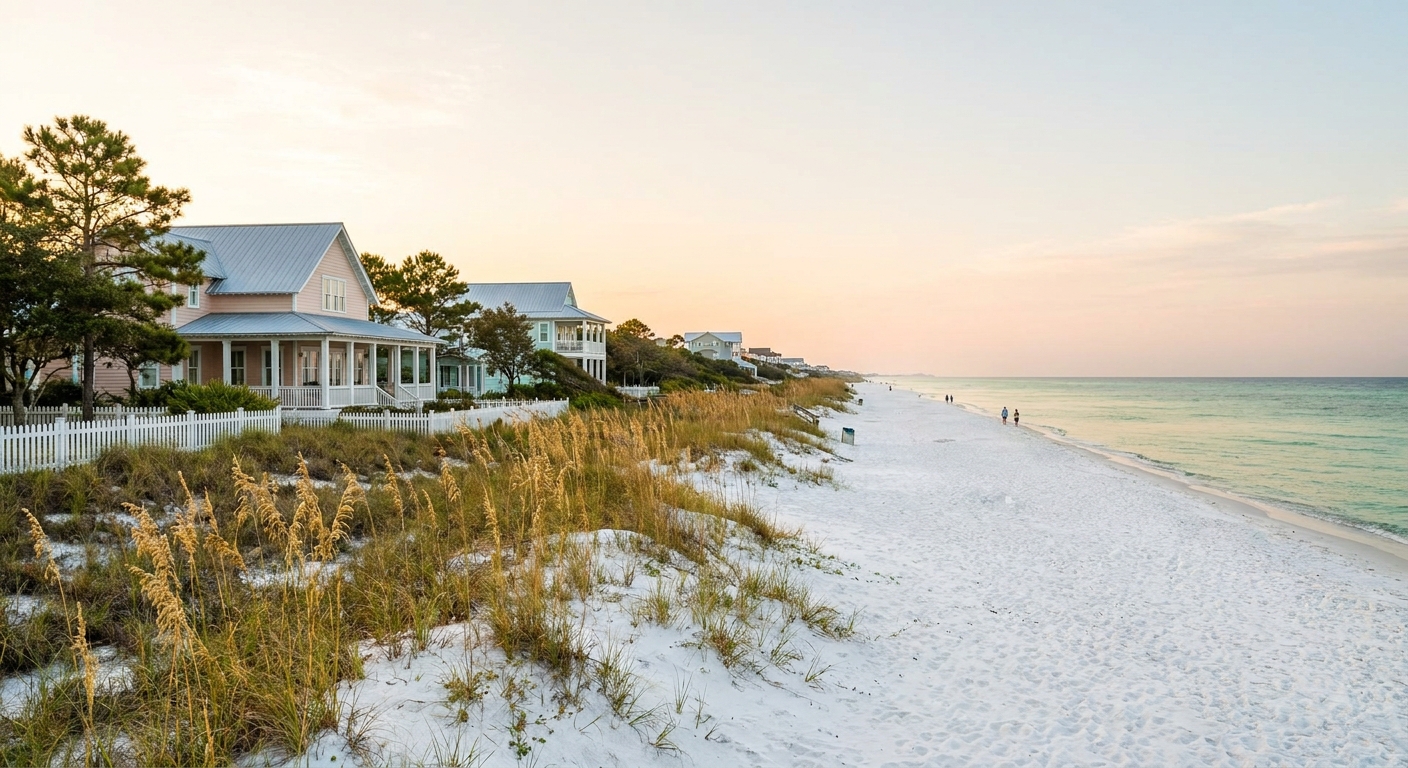
THE MONTH AT A GLANCE · GULF ISLANDS NATIONAL SEASHORE · JUNE
June suits a swimming trip to Gulf Islands National Seashore: sea at 82.9°F, 14 hours of daylight, and afternoons hot enough to plan the day around.
HIGH 88.9°F · SEA 82.9°F · 6.1 RAIN DAYS · HURRICANE SEASON FROM JUN 1
Go for: long swims in 82.9°F water, beach mornings after a 5:41 am sunrise, and warm nights that average 74.1°F.
Think twice before: booking non-refundable during hurricane season, or planning midday walks on open sand under 88.9°F highs.
Climate: NOAA NCEI station normals · Sea: Open-Meteo Marine API · Light: sunrise-sunset.org · full sources at the end
On this page
- Gulf Islands weather in JuneHighs of 88.9°F, 6.1 rain days
- Can you swim in June?Sea at 82.9°F, a daily-maxima average
- Crowds and prices in JuneSummer vacation season and refundable booking
- Things to do in JuneFort Pickens, Perdido Key and dusk swims
- Two-day June itineraryTwo days from 5:41 am sunrise to 7:49 pm sunset
- June vs May and JulyMay runs 5.4°F cooler, July 2.0°F hotter
- Is June a good time to visit?Yes for swimmers, with a hurricane-season caveat
Every figure here carries its source, and the air normals come from one thermometer at the seashore’s eastern end. The park’s units and year-round basics are in our Gulf Islands guide, and Florida’s twelve-month picture is in the best time to visit Florida.
Gulf Islands National Seashore weather in June: average highs, lows and rain days
| June measure | Value | Source |
|---|---|---|
| Average high | 88.9°F (31.6°C) | NOAA NCEI 1991-2020 |
| Average low | 74.1°F (23.4°C) | NOAA NCEI 1991-2020 |
| Precipitation | 4.70 in | NOAA NCEI 1991-2020 |
| Days with 0.10 in or more | 6.1 | NOAA NCEI 1991-2020 |
| Days with 1 in or more | 1.4 | NOAA NCEI 1991-2020 |
| Sea surface (mean of daily maxima) | 82.9°F (28.3°C) | Open-Meteo Marine API, 2015-2024 |
| Daylight on June 15 | 14 h 08 min | sunrise-sunset.org |
| Sunrise / sunset on June 15 | 5:41 am / 7:49 pm CDT | sunrise-sunset.org, converted from UTC |
NOAA’s National Centers for Environmental Information publish the 1991-2020 normals we use, from station USW00053853, a real thermometer at South Walton in the Panhandle. June there averages a high of 88.9°F and a low of 74.1°F, with 4.70 inches of rain. The seashore runs 160 miles west from that station into Mississippi, so these are the eastern end’s numbers. We did not find a station normal for Perdido Key or the Mississippi islands, and conditions there can differ.
Rain reaches a tenth of an inch on 6.1 days of an average June, roughly one day in five. Only 1.4 days bring an inch or more, so a typical June delivers one or two real soakings and a handful of lighter showers. Florida’s wet season leans toward afternoon thunderstorms, as our Florida guide explains, so put the long beach session in the morning and keep a covered option for the afternoon.
Between the 88.9°F afternoon and the 74.1°F night sits a spread of 14.8°F, and neither end calls for warm clothes. Pack a brimmed hat, sunscreen, a long-sleeved sun shirt for open dunes and fort walls, and a light rain shell for storm days. One thin layer covers air-conditioned restaurants in the evening.
On June 15 the seashore gets about 14 hours 08 minutes of daylight. Sunrise comes at 5:41 am and sunset at 7:49 pm Central Daylight Time, converted from sunrise-sunset.org’s UTC figures, and the seashore from Florida to Mississippi keeps Central time. A swim that starts at 7 pm still has close to an hour of sun.
Swimming at Gulf Islands National Seashore in June: sea temperature
Open-Meteo’s Marine API puts the sea surface off the seashore at 82.9°F in June, averaged over 2015-2024. That figure is a mean of daily maxima, the warmest reading of each day, so it runs a shade above a 24-hour average. A table that averages round the clock will print a slightly lower number for the same water. The marine figure also comes from a different source and period than the NOAA air normals.
Water at 82.9°F sits 6°F below the average afternoon high of 88.9°F, so wading in takes no bracing, and most swimmers can stay in for long stretches without a wetsuit. Against May’s 78.2°F, the June sea is 4.7°F warmer. Children and snorkelers who chill quickly notice that difference first.
We could not read wind or wave data for June, so we give no surf or chop figure. Check the National Weather Service surf-zone forecast on the morning of each swim, and remember that June falls inside hurricane season, dated June 1 to November 30 by NOAA. Rip-current advice is in our Florida safety guide.
How busy is Gulf Islands National Seashore in June? Crowds and prices
June falls in the American school summer break, the calendar season for family trips. We found no occupancy series or monthly room-rate data for the area, so we crown no month cheapest or dearest. Our Florida trip-cost guide prices a stay in three tiers you can apply here.
The booking decision that shapes a June trip is where you sleep. With 160 miles between the seashore’s eastern end and its Mississippi units, a base near the section you plan to use saves hours of driving across a two-day itinerary. We have no lead-time data, so we give no number of weeks to book ahead.
We could not verify the lodging-tax rate for the towns along the seashore, so we give no percentage. Compare stays on the total at checkout, taxes and fees included.
Pay for a refundable rate before you pay for a sea view. Hurricane season opened on June 1, and a booking you can cancel protects the trip if a storm system forms in the Gulf. Florida planning basics are in our know-before-you-go guide.
Things to do in Gulf Islands National Seashore in June
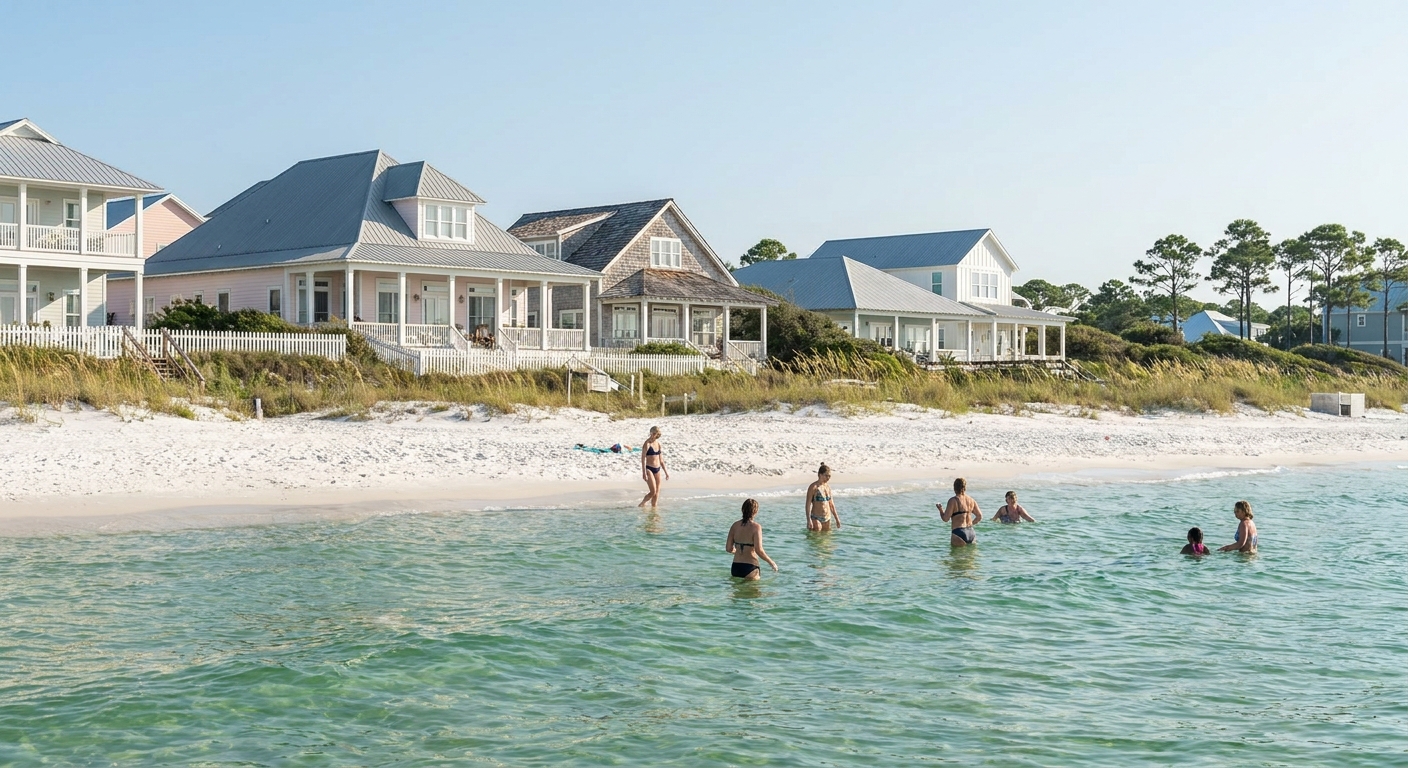
June pairs warm water with long light: 82.9°F at the daily peak and 14 hours 08 minutes of sun on the 15th. That opens two swim windows a day, one after the 5:41 am sunrise and one before the 7:49 pm sunset. In May the sea sits 4.7°F cooler, and the evening dip gets shorter.
Fort Pickens guards the western tip of Santa Rosa Island, a brick fort with beach on either side of the island. Johnson Beach on Perdido Key runs toward the Alabama line. Naval Live Oaks in Gulf Breeze trades sand for trails under live oaks. Across the state line, Davis Bayou near Ocean Springs anchors the Mississippi side. We could not verify 2026 entrance fees, opening hours or parking capacity for these areas, so we give none. The National Park Service posts them for each unit.
June shifts the air around these places far more than the water. On an 88.9°F afternoon the fort’s brick and the open sand soak up heat, while the sea sits 6°F cooler. In May that gap is 5.3°F, and in July 5.0°F. Tour Fort Pickens in its first open hours, take the Naval Live Oaks shade at midday, and keep the open beaches for early and late.
We could not verify a fee-free entrance day for June 2026, so we name none; the National Park Service announces its fee-free dates on nps.gov. Once you are inside a unit, the 7:49 pm sunset on the 15th and a dawn walk along the tide line cost nothing extra.
Gulf Islands National Seashore in June: a two-day itinerary
Start day one on the sand at Fort Pickens soon after the 5:41 am sunrise and swim before 9, while the air is still well below its 88.9°F peak. Walk the fort in its first open hours, then move under cover for the middle of the day, when Florida’s wet-season storms tend to build. Return to the beach around 5 pm for a second swim and stay for the 7:49 pm sunset.
Day two begins on the shaded trails of Naval Live Oaks, then heads west to Johnson Beach on Perdido Key for the afternoon and evening water. If the weather turns, swap the order and wait it out. A heavy-rain day is uncommon, 1.4 in an average June, but any thunderstorm means leaving the water and the open beach until the lightning has moved off.
Gulf Islands National Seashore in June vs May and July
| Normal | May | June | July |
|---|---|---|---|
| Average high | 83.5°F | 88.9°F | 90.9°F |
| Average low | 68.0°F | 74.1°F | 76.2°F |
| Precipitation | 3.22 in | 4.70 in | 5.77 in |
| Days with 0.10 in or more | 3.7 | 6.1 | 7.2 |
| Sea surface (daily maxima, 2015-2024) | 78.2°F | 82.9°F | 85.9°F |
From May to June, the NOAA normals add 5.4°F to the afternoon and 6.1°F to the night, 1.48 inches of rain and 2.4 rain days. July pushes on by smaller steps: 2.0°F by day, 2.1°F by night, 1.07 more inches and 1.1 more rain days. The sea, from the Open-Meteo Marine API, climbs 4.7°F into June and another 3.0°F into July.
Moving four weeks earlier to May buys nights at 68.0°F, 3.7 rain days and dates before hurricane season opens, at the cost of a sea at 78.2°F. Moving to July buys the warmest water of the three at 85.9°F, and brings the hottest highs and the most rain along with it.
Is June a good time to visit Gulf Islands National Seashore?
Yes, for swimmers, beach-first families and anyone who wants long evenings on the sand. Less so for travelers set on midday walks in the open, or who cannot move their dates if a tropical system forms: highs average 88.9°F, and the month sits inside hurricane season.
If June’s heat rules it out, choose May: highs of 83.5°F, nights at 68.0°F, 3.7 rain days instead of 6.1, and dates before the June 1 start of hurricane season. Expect a sea at 78.2°F, cool enough that some swimmers will keep sessions shorter.
Of the three months we compared, June alone pairs a sea above 82°F with fewer than seven rain days, and it brings the year’s longest daylight around the June solstice.
The last word
Book a refundable room near the unit you plan to swim at, then build each day around 5:41 am and 7:49 pm. One more number for dusk swimmers: the sea’s 82.9°F daily peak sits 8.8°F above the average June night low of 74.1°F, so wading in after sunset often feels warmer than the air on your shoulders.
Sources & data for this guide
- May, June and July air normals (highs, lows, precipitation, days at 0.10 inch and 1 inch) · NOAA NCEI monthly normals 1991-2020, station USW00053853, South Walton · checked Sep 24, 2026
- Station scope · the station sits at the seashore’s eastern end, which runs 160 miles west into Mississippi · NOAA NCEI · checked Sep 24, 2026
- Sea surface 78.2°F (May), 82.9°F (June), 85.9°F (July) · mean of daily maxima, 2015-2024 · Open-Meteo Marine API · checked Sep 24, 2026
- Daylight 14 h 08 min, sunrise 10:41 UTC and sunset 00:49 UTC on June 15, converted to CDT (UTC-5) · sunrise-sunset.org · checked Sep 24, 2026
- Hurricane season June 1 to November 30 · NOAA National Hurricane Center, via our Florida guide · checked Sep 24, 2026
- We could not verify 2026 entrance fees, unit hours, parking, fee-free days, wind and wave data, lodging-tax rates or room rates · check nps.gov and your booking total before you go.
To plan your stay
- Best Time to Visit Gulf Islands National Seashore: Weather, Sea Temperature and the Quiet Months
- Gulf Islands National Seashore in May: Weather, Sea Temperature, Crowds and a Two-Day Itinerary
- Gulf Islands National Seashore in July: Weather, Sea Temperature, Rain and Crowds
- Gulf Islands National Seashore in April: Weather, Water Temperature and Crowds