
SOUTH WALTON · FLORIDA PANHANDLE · THE 12-MONTH VERDICT
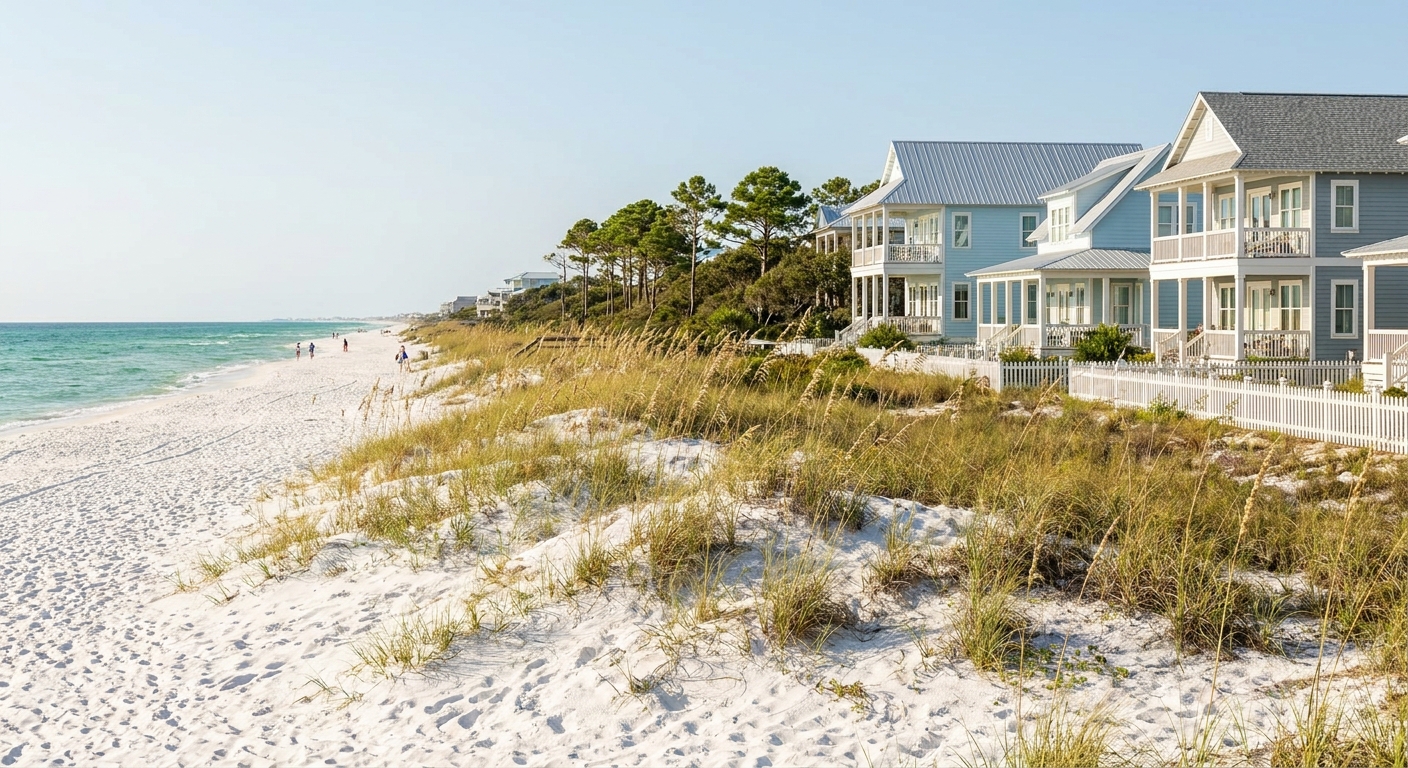
South Walton sells one thing above all others: quartz sand pale enough to hurt your eyes, low dunes behind it, and a string of beach neighborhoods threaded along County Road 30A. Nobody arrives wondering whether the beach delivers. The question is which month hands you water you’ll willingly swim in, an afternoon that doesn’t dissolve into thunder, and sand you aren’t sharing with three school districts.
That answer sits inside a fairly small spread of numbers. The Gulf here runs above 78°F for six months and falls to 60.4°F by January. Rain never takes a season off, so the useful measure is wet days rather than inches: August records 8.1 of them, October 3.5. Get the month right and the rest of the trip mostly arranges itself.
THE YEAR AT A GLANCE · SOUTH WALTON
October is the pick: 80.9°F days, 2.82 inches of rain, 3.5 wet days and a Gulf still averaging 78.9°F, with the caveat that hurricane season runs to November 30.
BEST MONTH: OCTOBER · SWIM WINDOW: MAY TO OCTOBER · HARDEST MONTH: AUGUST
Go for: October and May, the only two months under 3.7 wet days with the Gulf above 78°F.
Think twice before: booking August, with 8.1 wet days, nights that hold at 75.8°F and the busiest stretch of hurricane season opening mid-month.
Air: NOAA NCEI 1991-2020 normals · Sea: Open-Meteo Marine · Storms: NOAA NHC · full sources at the end
On this page
- Highs, lows, rain and sea, month by monthThe twelve-month table
- The single best month to bookOctober, and why not September
- When the water is warm enough to swimSea above 78°F, May to October
- The quietest weeks on 30AAfter Labor Day, and midwinter
- The month to avoidAugust: 8.1 wet days, 90.6°F
- Is April, May, October or November worth it?What the shoulder trades away
One line settles most South Walton arguments: the Gulf averages above 78°F from May through October, and 60.4°F in January. Daylight, rain and crowds all arrange themselves around that window.
South Walton weather month by month: highs, lows, rain and sea
| Month | Avg high | Avg low | Rain | Days ≥ 0.10 in | Sea (avg daily max) |
|---|---|---|---|---|---|
| January | 63.1°F | 45.3°F | 4.52 in | 5.6 | 60.4°F |
| February | 65.8°F | 47.9°F | 4.96 in | 5.3 | 62.1°F |
| March | 70.7°F | 53.6°F | 4.70 in | 5.2 | 67.5°F |
| April | 76.2°F | 60.1°F | 4.55 in | 4.0 | 71.0°F |
| May | 83.5°F | 68.0°F | 3.22 in | 3.7 | 78.2°F |
| June | 88.9°F | 74.1°F | 4.70 in | 6.1 | 82.9°F |
| July | 90.9°F | 76.2°F | 5.77 in | 7.2 | 85.9°F |
| August | 90.6°F | 75.8°F | 6.08 in | 8.1 | 87.8°F |
| September | 88.5°F | 72.4°F | 5.18 in | 5.3 | 85.9°F |
| October | 80.9°F | 63.2°F | 2.82 in | 3.5 | 78.9°F |
| November | 72.1°F | 53.0°F | 4.13 in | 4.3 | 72.4°F |
| December | 65.6°F | 47.5°F | 4.72 in | 6.5 | 65.9°F |
The year runs warm for a long stretch and cool for a short one. Five months, May through September, hold average highs at or above 83.5°F, while only January, February and December stay under 66°F. Rain, by contrast, never clocks off: ten of the twelve months clear four inches, and the two exceptions, October at 2.82 and May at 3.22, are exactly the months everyone eventually recommends.
Two hinges do the real work. April is pleasant at 76.2°F with 4.0 wet days, but the water sits at 71.0°F, fine for a nine-year-old and bracing for the adults watching. A month later the Gulf has reached 78.2°F and rainfall has dropped to 3.22 inches. October swings the other way: highs fall from September’s 88.5°F to 80.9°F, the sea gives up 7.0°F (85.9 to 78.9), and precipitation nearly halves, 5.18 inches down to 2.82.
August is the hardest month, and not for everyone equally. Highs of 90.6°F with lows of 75.8°F mean the nights never really recover, 8.1 days record at least 0.10 inch and 1.8 of them top a full inch. Beach mornings survive that. Bike rides on the 30A path, tennis, a round of golf and any plan built around midday do not. Mid-August also opens the busiest stretch of the Atlantic hurricane season, which peaks on September 10.
Every air figure here comes from the NOAA 1991-2020 normals at station USW00053853, Destin-Fort Walton Beach Airport, which sits west of the 30A corridor on a runway rather than on the dune line. Wet days are counted at 0.10 inch of precipitation, the heavier tally at a full inch. Sea readings have another pedigree entirely: Open-Meteo’s marine series, averaged over 2015 to 2024 offshore.
When is the best time to visit South Walton?
October, without much hesitation. It is the driest month of the twelve at 2.82 inches, with the fewest wet days at 3.5, days that average 80.9°F and nights at 63.2°F, and a Gulf still averaging 78.9°F, warmer than May’s. Daylight on October 15 runs 11 hours 28 minutes, with the sun down at 6:14 p.m. Central, which is enough for a beach afternoon and a walk afterward.
September gets recommended out of habit and loses on every count: 7.6°F hotter by day, 2.36 more inches of rain, 1.8 more wet days, and the statistical peak of hurricane season on the 10th. May is the one genuine rival, at 3.22 inches, 3.7 wet days and water at 78.2°F, with 13 hours 45 minutes of daylight on the 15th and sunset at 7:33 p.m. May also sits ahead of June 1, when the season opens. October is drier and marginally warmer in the water; May gives you two hours and seventeen minutes more light.
One warning about borrowed calendars. Florida’s famous dry season, November through April, describes the peninsula, not this coast: December records 4.72 inches here and January 4.52, both wetter than October. The Panhandle keeps its own accounts, which is worth holding in mind against the statewide view in when to visit Florida and when you plan a longer drive across the state.
When can you swim in South Walton? Sea temperature month by month
Set the line at 78°F, the point where nobody stands at the water’s edge negotiating. Six months clear it: May at 78.2, June 82.9, July 85.9, August 87.8, September 85.9 and October 78.9. November falls just short at 72.4 and April at 71.0, both swimmable for children and for anyone who grew up on a northern lake. March drops to 67.5, December 65.9, February 62.1, and January bottoms out at 60.4°F, which is a wetsuit or a long walk.
Read those figures for what they are: averages of the daily maximum sea surface, taken over 2015 to 2024, so they run a shade warmer than a 24-hour mean. A 7 a.m. swim in an October averaging 78.9°F meets water cooler than the number promises, and a single cold front can pull a couple of degrees out of a week. Ten Octobers of data describe the odds, not your Tuesday.
When is South Walton quietest?
The calendar says it plainly, without needing a price chart. The quiet runs from the week after Labor Day to Thanksgiving, and again from mid-January to the start of spring break in March. Summer belongs to school holidays, March belongs to spring break, and the stretch from late May through early August is the peak by definition, not by rumor.
Going quiet in the fall means taking the best weather of the year with the fewest people in it: October’s 3.5 wet days, 78.9°F water and a 6:14 p.m. sunset. Midwinter offers something different. January highs of 63.1°F are poor swimming and excellent walking, and the coastal dune lakes and state park trails are at their most comfortable when the humidity has gone.
What you give up is specific. January water at 60.4°F ends the swimming argument, 3.2 nights in an average January fall to 32°F or below, and daylight on the 15th runs 10 hours 27 minutes with the sun gone by 5:07 p.m. February still averages one freezing night. Some 30A kitchens, rental counters and beach services also trim their hours in deep winter (est.), so a Tuesday in January is not a Tuesday in June with fewer cars.
Which month should you avoid in South Walton?
August, if your trip involves anything beyond sand, shade and water. It is the wettest month at 6.08 inches, carries 8.1 wet days and 1.8 days over a full inch, and holds nights at 75.8°F, so the house never cools without help. Families locked to the school calendar will go anyway, and they should plan for early mornings and late evenings rather than pretend the middle of the day is usable. Travelers who can move should move.
In its defense, August owns the warmest water of the year at 87.8°F, closer to a bath than a swim, plus 13 hours 16 minutes of daylight on the 15th and sunset at 7:27 p.m. Its rain tends to arrive in heavy afternoon bursts rather than gray all-day drizzle. And its 90.6°F average high is fractionally below July’s 90.9, which surprises people who assume the worst month is the hottest one.
Is the shoulder season worth it in South Walton?
The shoulders here are April and May on one side, October and November on the other, and the gaps to high summer are large. April’s 76.2°F average high runs 14.7°F below July’s 90.9. November’s 72.1°F is 18.5°F below August’s 90.6. On wet days the spread is starker still: 3.5 in October and 3.7 in May against 8.1 in August.
That buys two things summer cannot sell. First, dry ground: October’s 2.82 inches is the lowest total of the twelve months, and May’s 3.22 the second. Second, a usable afternoon, since 76°F to 83°F is weather for cycling the 30A path or paddling a dune lake rather than retreating indoors until five. May carries a bonus the fall shoulder cannot match, sitting entirely ahead of the June 1 opening of hurricane season.
The bill comes in light and in water. Daylight on October 15 is 11 hours 28 minutes against 14 hours 08 minutes on June 15, a loss of 2 hours 40 minutes, and sunset moves from 7:49 p.m. back to 6:14 p.m. The outer shoulder months miss the swim line outright: April at 71.0°F and November at 72.4°F, both below the 78°F mark that May and October clear.
So the shoulder splits in two. May and October are full beach months wearing a quieter calendar, and there is no reason to pay summer’s crowd for July’s 7.2 wet days. April and November are shoulder for walkers, cyclists and people who came for the dunes, with swimming as a dare rather than a plan.
The last word
Two months are worth booking and the choice between them is simple: take October for the driest air of the year and 78.9°F water, or take May for 2 hours 17 minutes more daylight and a date ahead of hurricane season. One number applies to both, and to every other month. Walton County levies a 5.0% transient rental tax on top of Florida’s 6% sales tax, so the nightly rate you were quoted for that dune-facing cottage is not the rate you will pay. Budget the eleven percent, then go argue about the water.
Sources & data for this guide
- Monthly highs, lows, precipitation, wet days and freezing nights · NOAA NCEI 1991-2020 monthly normals, station USW00053853, Destin-Fort Walton Beach Airport · checked Sep 14, 2026
- Sea surface temperatures, given as the mean of daily maxima, 2015-2024 · Open-Meteo Marine API · checked Sep 14, 2026
- Daylight length, sunrise and sunset (UTC, converted to America/Chicago) · sunrise-sunset.org · checked Sep 14, 2026
- Atlantic hurricane season dates and the September 10 climatological peak · NOAA National Hurricane Center · checked Sep 14, 2026
- Walton County 5.0% transient rental tax and the 6% state sales tax · Florida Department of Revenue, form DR-15TDT · checked Sep 14, 2026
- Editorial admission: the quiet weeks are keyed to school holidays and Labor Day, not to any measured occupancy series, and no price data underlies this page · off-season business hours are an estimate.