
AZORES · BEST TIME TO VISIT · 1991-2020 NORMALS
Nothing in the Azorean year is extreme, which is exactly what makes the timing hard. Average highs travel from 63.3°F in February to 78.8°F in August, a swing of 15.5°F across twelve months. Rain does the real dividing: 1.02 inches in an average July against 6.02 inches in December, 4.8 wet days against 15.0.
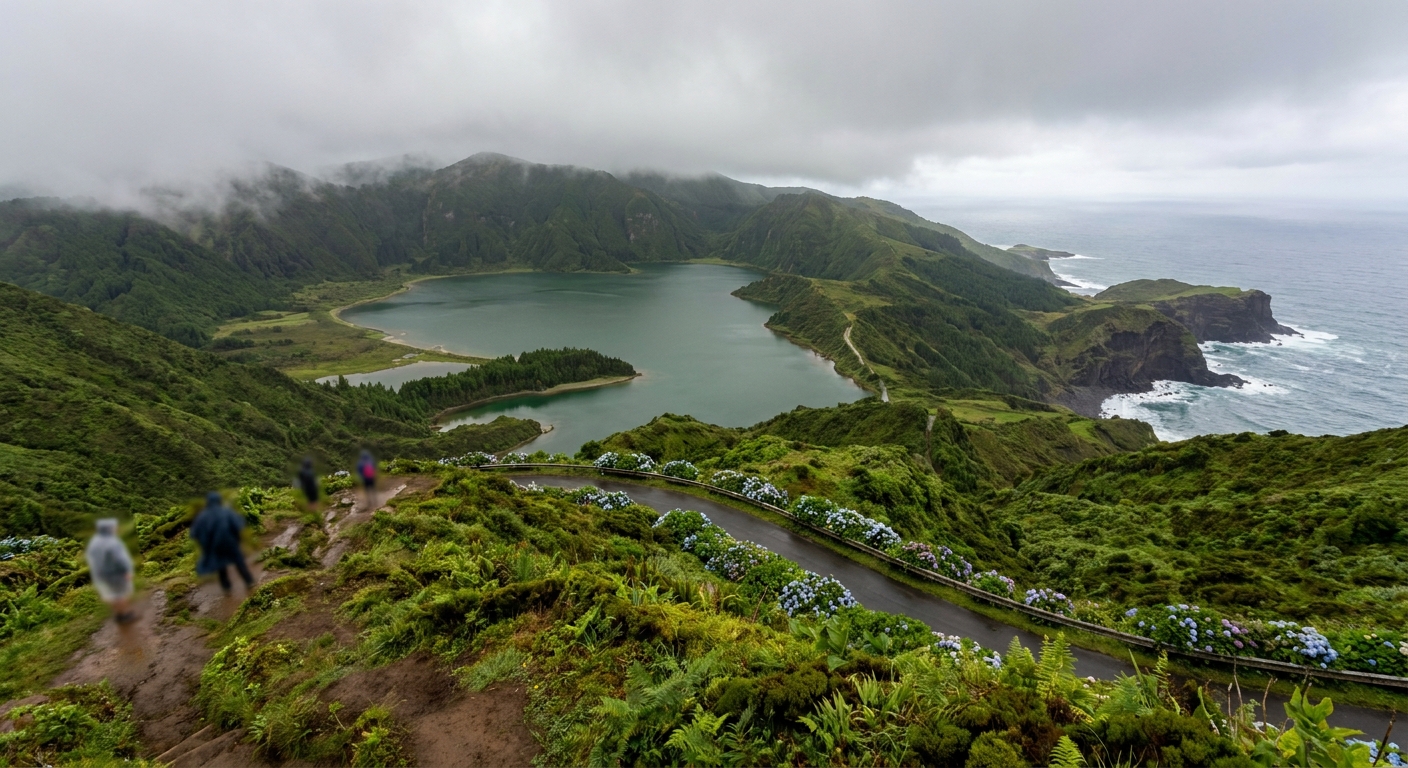
So the question was never whether it will be warm. It is how many of your days get rained on, how warm the water is when you finally reach it, and whether the road up to a crater rim ends inside a cloud. Our answer, with the arithmetic underneath it: September for most travelers, June for anyone who cares more about daylight than about swimming.
THE YEAR AT A GLANCE · AZORES
Go in September: 77.0°F days, a sea averaging 75.3°F, and 9.4 wet days against August’s 6.5, which is the price of standing outside the holiday peak.
BEST: SEPTEMBER · WARMEST: AUGUST 78.8°F · WETTEST: DECEMBER 6.02 IN · FIGURES FROM PONTA DELGADA
Go for: water at 75.3°F in September and 77.0°F in August, 6.6 wet days in an average June, and the year’s longest daylight at 14 hours 49 minutes on June 15.
Think twice before: booking a hiking week in December or October: 15.0 and 13.7 days of measurable rain, with 4.5 and 3.5 of them at 10 mm or more.
Normals 1991-2020: IPMA station 513, Ponta Delgada · Sea: Open-Meteo Marine 2015-2024 · full sources at the end
On this page
- Month-by-month highs, rain days and sea temperatureThe twelve-month table
- The single best month to bookSeptember, with the numbers
- When the water is warm enough to swimJuly through October
- The quiet months outside school holidaysJanuary to March
- The month with 15 wet daysDecember, and who it hurts
- May, June and October side by sideThe shoulder verdict
Three numbers decide most Azores trips: how warm the sea is, how many days record rain, and how long the sun is up. All three peak between June and September, so the choice usually comes down to one month on either side of that window. Each month also keeps its own page, January to December, with its sunrise and sunset times. Where the trip also takes in the mainland, Portugal’s calendar gives a different answer.
Azores weather month by month: highs, lows, rain and sea
| Month | Avg high | Avg low | Rain | Days ≥1 mm | Sea | Daylight (15th) |
|---|---|---|---|---|---|---|
| January | 63.5°F | 54.9°F | 4.02 in | 13.0 | 63.3°F | 9h53 |
| February | 63.3°F | 53.8°F | 3.43 in | 10.8 | 62.7°F | 10h51 |
| March | 64.2°F | 54.7°F | 3.82 in | 11.7 | 61.9°F | 12h00 |
| April | 65.8°F | 55.9°F | 3.13 in | 10.2 | 63.0°F | 13h15 |
| May | 68.4°F | 58.3°F | 2.40 in | 8.7 | 65.9°F | 14h16 |
| June | 72.3°F | 62.2°F | 1.75 in | 6.6 | 69.5°F | 14h49 |
| July | 76.5°F | 66.0°F | 1.02 in | 4.8 | 73.1°F | 14h34 |
| August | 78.8°F | 67.8°F | 1.80 in | 6.5 | 77.0°F | 13h39 |
| September | 77.0°F | 66.4°F | 3.08 in | 9.4 | 75.3°F | 12h28 |
| October | 72.7°F | 62.8°F | 4.65 in | 13.7 | 72.3°F | 11h16 |
| November | 67.8°F | 58.8°F | 3.75 in | 11.8 | 68.4°F | 10h11 |
| December | 64.9°F | 56.1°F | 6.02 in | 15.0 | 65.4°F | 9h37 |
The table has one shape: a long mild middle with the rain stacked at both ends. From May to September the wet-day count stays under ten and bottoms out at 4.8 in July. From October to January it sits between 11.8 and 15.0. Temperature barely reacts, moving 15.5°F all year, while precipitation multiplies almost sixfold between July and December.
Two months do the tipping. September holds summer’s water at 75.3°F under 77.0°F days, and then October cuts the sea to 72.3°F and pushes wet days from 9.4 to 13.7. At the other end, February is the pivot back: rainfall falls to 3.43 inches from December’s 6.02, and wet days from 15.0 to 10.8, the lowest count between November and March.
December is the hardest month of the year, and it is hard for one kind of traveler above all: the one with a fixed week and a list of viewpoints. Fifteen days record at least 1 mm of rain, 4.5 of them 10 mm or more, and daylight on the 15th runs 9 hours 37 minutes, the shortest reading in the calendar. Nobody books December for the beach. Plenty book it for five hikes, and that is the itinerary that comes apart.
Where these numbers come from matters more here than in most places. The normals are 1991-2020 readings from IPMA station 513, the Ponta Delgada observatory, 35 meters above the sea on the south coast of São Miguel: one coastal thermometer, not an archipelago. The Sete Cidades rim, Pico’s slopes and the north-facing coasts run colder and far wetter, which is a packing problem as much as a planning one (our packing list). The rain-day counts use the Portuguese service’s own thresholds, 1 mm (0.04 inch) and 10 mm (0.39 inch), not the 0.10-inch cutoff of American tables.
When is the best time to visit the Azores?
September, with very little hedging. Days average 77.0°F, the sea averages 75.3°F, second-warmest of the year, and 12 hours 28 minutes of mid-month daylight leaves room for a caldera in the morning and a swim in the afternoon. The bill comes to 3.08 inches of rain over 9.4 wet days, 1.9 of them heavy. That is a small tax on a very good month.
August looks better on paper, 78.8°F days and 6.5 wet days against September’s 9.4, and it is also the month the Portuguese and continental European school holidays land on. October is the other neighbor, and it charges more: the sea gives back 3.0°F, down to 72.3°F, and wet days climb by 4.3, up to 13.7. September sits in the gap between the crowd and the rain, paying under three extra wet days for it.
That month’s detail lives on our September page, daylight hours and all. Travelers locked into August or October will find their own month handled the same way, figure by figure, with no need to reverse-engineer it from the table above.
When can you swim in the Azores? Sea temperature month by month
Four months clear 70°F: July at 73.1°F, August at 77.0°F, September at 75.3°F and October at 72.3°F. June misses by half a degree at 69.5°F, which some swimmers will never notice and a few will announce loudly. Below that the water turns properly Atlantic: 65.9°F in May, 65.4°F in December, and an annual floor of 61.9°F in March, the coldest sea of the year arriving a full month after the coldest air.
One caveat sits under every sea figure here. Each is a mean of daily maxima over 2015 to 2024, not a 24-hour average, so it describes the ocean at its warmest hour rather than at breakfast. Expect an early swim to read below the monthly number. Expect a sheltered south-coast pool at four in the afternoon to beat it, and a north-facing cove in a swell to feel like a different month entirely.
When are the Azores quietest?
The quiet stretch is a fact of the calendar rather than a price ranking: January, February and March, the weeks between the New Year holiday and Easter, with a second lull through November. No Portuguese or continental school holiday falls in those months. That is the whole mechanism. We carry no price series for the islands, so no month here gets called the cheapest.
What the traveler gains in those weeks is a mild archipelago with room in it. February’s average high of 63.3°F is 9.0°F below June’s and 15.5°F below August’s, which in practice means a fleece and not a parka. Late winter is also drier than the fall: 3.43 inches in February and 3.82 in March, against October’s 4.65 and December’s 6.02, with 10.8 and 11.7 wet days rather than 13.7 and 15.0.
The losses are specific, and worth naming before booking. Swimming leaves the table, with the sea at 62.7°F in February and 61.9°F in March. Light gets scarce: 9 hours 53 minutes on January 15 and 10 hours 51 minutes on February 15, against 14 hours 49 minutes on June 15, so a day fits two viewpoints and not a third. January also averages 3.2 days at 10 mm or more, which makes one washed-out day in a five-day trip a normal outcome.
Which month should you avoid in the Azores?
December, for hikers and for anyone whose trip is exactly one week long. Rainfall reaches 6.02 inches, the annual maximum, spread across 15.0 days at 1 mm or more and 4.5 days at 10 mm or more, both calendar records. Mid-month daylight is down to 9 hours 37 minutes. None of that is dangerous. It is simply the month with the highest odds that your single attempt at a crater rim is a gray wall.
December redeems itself twice over. The December sea averages 65.4°F, warmer than April’s 63.0°F and well above the March floor of 61.9°F, an ocean-lag quirk that catches out anyone assuming winter water is coldest in winter. The air stays gentle too: a 64.9°F average high beats March’s 64.2°F. For a Christmas week of harbor towns, hot springs and short coastal walks between showers, December holds up better than its rain column suggests.
Azores in the shoulder season: May, June and October
The shoulder months are May, June and October, and their distance from high summer is nothing like uniform. May runs 10.4°F cooler by day than August (68.4°F against 78.8°F) with the sea 11.1°F cooler at 65.9°F. June closes most of that gap: 72.3°F days, 69.5°F water, 6.6 wet days against August’s 6.5. October keeps the warm water at 72.3°F and surrenders the dry weather, 13.7 wet days.
June’s real payoff is light. Mid-month daylight runs 14 hours 49 minutes, the longest of the year, 15 minutes more than July and 1 hour 10 minutes more than August. On islands where the drive to a trailhead can eat half the morning, that extra hour is currency. May’s payoff is dryness for its temperature: 2.40 inches over 8.7 wet days, less rain than any month outside June, July and August.
What the shoulder takes away is measurable. A May swim means 65.9°F water, 11.1°F below August. October hands back 3.5 heavy-rain days inside a total of 13.7, close to half the month, plus 11 hours 16 minutes of daylight, three and a half hours short of June. Neither month gives you September’s combination of a warm sea and a mostly dry sky.
Cut it this way. June is the shoulder month that costs almost nothing: one tenth of a wet day more than August, water at 69.5°F, the longest days in the calendar. May suits walkers who were never going to swim. October earns its place only for travelers who will trade rain on close to half their days for 72.3°F water outside the full weeks.
The last word
Book September if the water matters and June if the light does, then stop optimizing: no month here is a write-off and none is a guarantee, since the same afternoon can hand you sun in Ponta Delgada and cloud on the Sete Cidades rim half an hour up the road. One date worth holding onto is March 15, when the sun is up for exactly 12 hours, the sea sits at its annual floor of 61.9°F and the rain is already down to 3.82 inches from December’s 6.02. Pack the shell jacket in every single month.
Sources & data for this guide
- Monthly normals 1991-2020 (highs, lows, precipitation, rain days) · IPMA station 513, Ponta Delgada Observatório, 35 m · checked Sep 9, 2026
- Rain-day thresholds of 1 mm (0.04 in) and 10 mm (0.39 in) are the Portuguese service’s own and are not interchangeable with the 0.10-inch counts in US tables · checked Sep 9, 2026
- Sea surface temperature, mean of daily maxima 2015-2024 · Open-Meteo Marine API · checked Sep 9, 2026
- Daylight length at mid-month · sunrise-sunset.org · checked Sep 9, 2026
- Editorial note: every figure above describes Ponta Delgada, on the south coast of São Miguel. Higher ground, the north coasts and the other islands run colder and wetter.
- Editorial note: the quiet months are read off the school-holiday calendar. We hold no Azores price or occupancy series, so this guide ranks no month as the cheapest.