
CASCAIS · THE 12-MONTH VERDICT · 38.7° N
An average August day in Cascais tops out at 84.2°F and the whole month records measurable rain on a single day. An average November brings 4.51 inches of it, spread across 9.3 days. Between those two lines sits the month most travelers should be booking, plus a couple of months that reward a very specific kind of trip.
The verdict is September: 80.2°F days, 1.41 inches of rain, and light until 7:45 p.m. on the 15th. May is the runner-up, November the month to move a swimming trip away from. Cascais takes three nights as a base, or one afternoon if you are already sleeping in Lisbon.
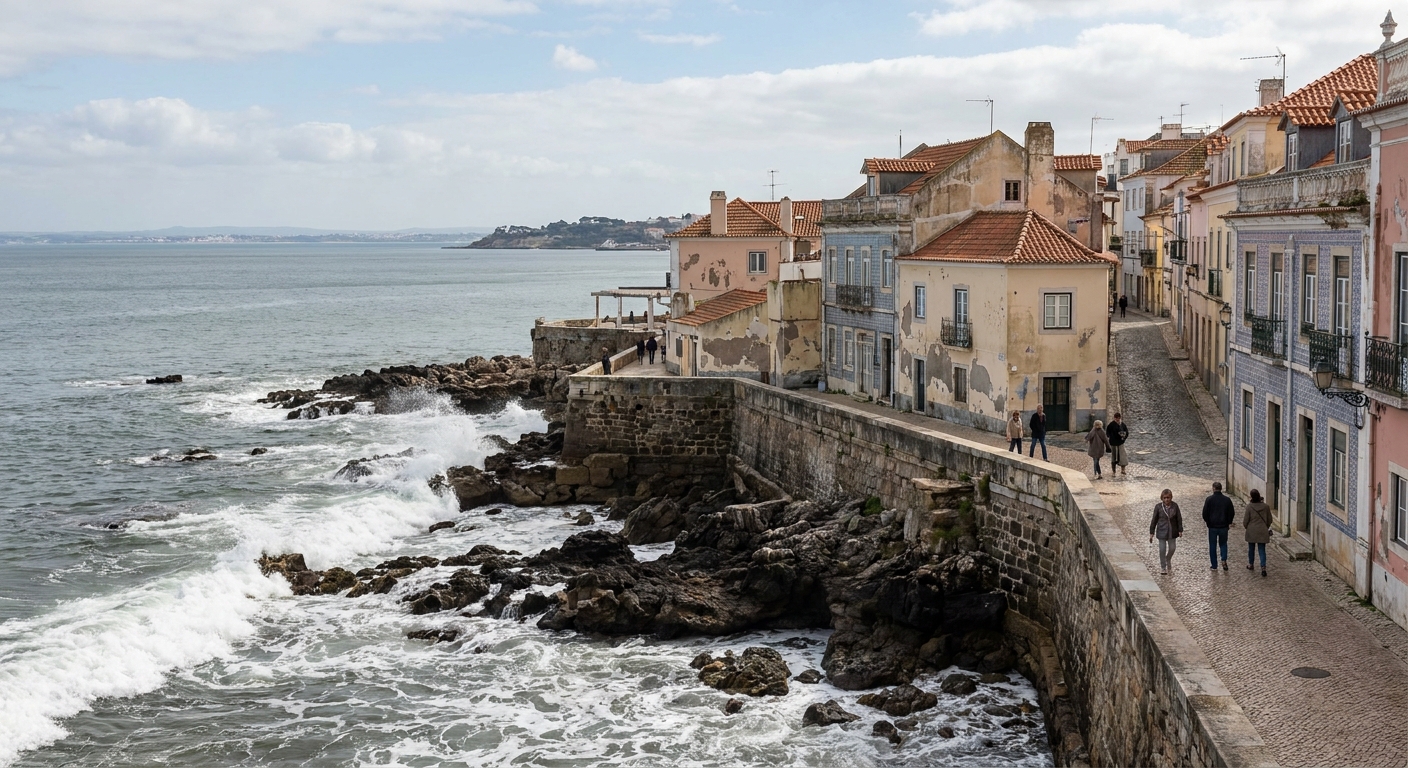
THE YEAR AT A GLANCE · CASCAIS
September is the month to book: 80.2°F days, 1.41 inches of rain and light until 7:45 p.m., with May as the runner-up and November the month to steer a beach trip away from.
BEST MONTH: SEPTEMBER · SHOULDER: MAY · OFF-SEASON: NOVEMBER TO FEBRUARY · NORMALS 1991–2020
Go for: September beach days at 80.2°F with only 3.7 rainy days, a May shoulder carrying 14 hours 21 minutes of daylight, and a coast that still works as a winter base for Lisbon and Sintra.
Think twice before: booking November for swimming: 4.51 inches of rain over 9.3 wet days, 3.9 of them at 10 mm or more, the heaviest count in the table.
Normals: IPMA 1991-2020, station 579 Lisboa Gago Coutinho · Daylight: sunrise-sunset.org · full sources at the end
On this page
- Cascais month by month: highs, lows, rainfallThe 12-month table
- The single best month to bookSeptember, with the numbers
- Summer highs and overnight lowsJuly and August, 82.9°F and 84.2°F
- The quietest months on the coastNovember to February, by daylight
- The month to skip for a beach tripNovember, 4.51 inches
- Shoulder season: May or October?May, by three hours of daylight
- When is Portugal at its best overall?The national 12-month verdict
One gap worth naming up front: the record used here carries air temperature, rainfall and rain-day counts, and no sea-surface series. No water temperature is quoted anywhere on this coast page, because none was read.
Cascais weather month by month: highs, lows and rainfall
| Month | Avg high | Avg low | Rain | Days ≥ 1 mm | Daylight on the 15th |
|---|---|---|---|---|---|
| January | 57.9°F | 46.0°F | 3.78 in | 9.9 | 9h48 |
| February | 60.3°F | 47.1°F | 2.80 in | 7.8 | 10h48 |
| March | 65.1°F | 50.5°F | 2.63 in | 7.2 | 12h00 |
| April | 67.8°F | 53.2°F | 2.50 in | 7.7 | 13h17 |
| May | 73.0°F | 57.4°F | 2.00 in | 5.7 | 14h21 |
| June | 79.0°F | 61.7°F | 0.53 in | 2.0 | 14h55 |
| July | 82.9°F | 64.4°F | 0.11 in | 0.4 | 14h39 |
| August | 84.2°F | 65.3°F | 0.20 in | 1.0 | 13h43 |
| September | 80.2°F | 63.3°F | 1.41 in | 3.7 | 12h29 |
| October | 72.7°F | 58.8°F | 4.05 in | 8.3 | 11h14 |
| November | 63.7°F | 52.2°F | 4.51 in | 9.3 | 10h06 |
| December | 58.8°F | 47.7°F | 3.94 in | 9.7 | 9h31 |
The year has a bone-dry core and a wet collar around it. June, July and August together average 0.84 inches of rain, and July’s 0.4 wet days work out to one rainy July day every two or three years. October and November between them average 8.56 inches, more than ten times the summer trio, and they do it on 17.6 days.
Two months do the switching. June is where the dry season actually lands, dropping from May’s 5.7 rainy days and 2.00 inches to 2.0 days and 0.53 inches. October runs the reverse: September’s 80.2°F high falls to 72.7°F, rainfall nearly triples from 1.41 inches to 4.05, and the rain days more than double, 3.7 to 8.3. Everything between those two hinges is stable.
4.51 inches of rain fall in an average November, across 9.3 days, of which 3.9 deliver 10 mm or more, the heaviest count in the table. That weight lands on one kind of traveler in particular: anyone here for the sea. For a walker or a museum-and-market visitor, December is the harder month, with 9 hours 31 minutes of daylight and the sun gone by 5:17 p.m.
Every figure here comes from IPMA, the Portuguese weather service, 1991-2020 normals at station 579, Lisboa Gago Coutinho. That thermometer stands at Lisbon’s airport, inland and 104 m (341 ft) up, while Cascais faces the open Atlantic and runs cooler and windier, especially on summer afternoons. The rain-day counts use the Portuguese thresholds, 1 mm (0.04 inch) and 10 mm (0.39 inch), not the 0.10-inch threshold of US tables, so the two sets of counts are not interchangeable.
When is the best time to visit Cascais?
Book September. Days average 80.2°F, nights 63.3°F, rain amounts to 1.41 inches over 3.7 days, and on the 15th the sun is still up at 7:45 p.m. Three nights covers the town and its beaches, four if you want a day up at Sintra, which sits close enough to be an easy morning out.
August buys you 4.0°F of extra daytime heat (84.2°F against 80.2°F), 2.7 fewer rainy days and daylight to 8:32 p.m. It is also peak vacation season on this coast. Pushing the other way costs far more: October strips 7.5°F off the daily high and adds 4.6 rainy days, which turns a beach week into a coat-and-café week.
Cascais sits inside a bigger decision, so take the national picture from Portugal’s twelve-month verdict, the routes and seasons from the flights guide, and the layer question from the packing list. An Atlantic September evening at 63.3°F wants a windproof layer, not a sweater from the hotel shop.
How hot does Cascais get in summer?
August is the warmest month at 84.2°F, with July at 82.9°F, September at 80.2°F and June at 79.0°F. The nights are what American visitors underestimate: lows average 61.7°F in June, 64.4°F in July, 65.3°F in August and 63.3°F in September, so no summer month averages below 61°F overnight. Rain all but stops, 0.4 wet days in July and 1.0 in August.
What these normals do not carry is humidity, wind speed or sea temperature, so no heat index and no water figure appear here. The wind gap matters most: the station is inland at 104 m while the Cascais seafront takes the Atlantic breeze, which is why an 84°F reading can turn into a jacket evening on the promenade by eight. If you meet a published sea temperature elsewhere, check its definition, since those are usually averages of daily maximum readings rather than the water at breakfast.
When is Cascais quietest?
November through February is the off-season on this coast, and that is a calendar statement rather than a price ranking: no occupancy or rate series was read for Cascais, so none is quoted. Daylight tells the story instead. Mid-November gets 10 hours 06 minutes, mid-December 9 hours 31 with sunset at 5:17 p.m., mid-January 9 hours 48, mid-February 10 hours 48.
What the winter traveler gains is a mild town with room in it. No month in the table averages a high below 57.9°F, and February is the quiet winner of the cold half: 2.80 inches of rain over 7.8 days, closer to March’s 2.63 inches than to January’s 3.78. With the trains running along the coast into the capital, a winter week here works as a base rather than a beach stay, as the transport guide lays out.
What the winter traveler loses is the water and the evening. Swimming is off the table, January averages 9.9 rainy days with 3.3 of them at 10 mm or more, and the sun sets at 5:39 p.m. on January 15. Seasonal restaurants and beach clubs also keep winter hours that no weather record can predict, so confirm opening days before you build an afternoon around one address.
Which month should you avoid in Cascais?
For anyone coming to swim or sunbathe, November is the month to move. It carries the year’s heaviest rainfall at 4.51 inches, the year’s most 10 mm days at 3.9, highs of only 63.7°F and just 10 hours 06 minutes of light. Nothing in the table punishes a beach plan harder.
Turn the same numbers around and November holds up for a different trip. Its 9.3 wet days leave roughly three weeks of the month recording less than 1 mm. Its 63.7°F days beat February’s 60.3°F, and mid-November still has 35 minutes more daylight than mid-December. Walkers, eaters and day-trippers into Lisbon lose very little.
Is the shoulder season worth it in Cascais?
The shoulders are May and October, and both land about 11°F below high summer: 73.0°F and 72.7°F against August’s 84.2°F. Their rainfall is where they part company, 2.00 inches in May and 4.05 in October.
May hands over something August cannot, which is length of day: 14 hours 21 minutes on the 15th, only 34 minutes short of the June peak, with sunset at 8:43 p.m. October’s compensation is different and smaller, 58.8°F nights, the mildest of any month outside June to September.
The bill comes in degrees and wet days. Against September, May gives up 7.2°F by day and 5.9°F at night, and adds 4.7 rainy days to August’s count. October gives up 4.6 rainy days to September (8.3 against 3.7) and 2.64 inches of extra rain.
May is worth it outright. October is worth it only when swimming is optional and the trip is built around the seafront promenade toward Estoril, the markets and the day trains. If the water is the point of the trip, move the dates forward rather than back.
The last word
Choose between two calendars and the rest sorts itself: September for the water, May for the long evenings. If both weeks are gone, March is the underrated option nobody puts on a beach list, with 7.2 rainy days, fewer than any month from October through April, and 65.1°F by day for coast walking. Price the week with the trip-cost guide before you commit flights, and pack the windproof layer whichever month wins.
Sources & data for this guide
- Monthly normals 1991-2020, highs, lows and precipitation · IPMA, station 579 Lisboa Gago Coutinho, altitude 103.9 m · checked Sep 12, 2026
- Rain-day counts at the 1 mm and 10 mm thresholds · IPMA normals 1991-2020, same station · checked Sep 12, 2026
- Daylight, sunrise and sunset on the 15th of each month, converted to local time · sunrise-sunset.org · checked Sep 12, 2026
- Editorial admission: the station stands at Lisbon’s airport, inland and 104 m up, so seafront readings in Cascais run cooler and windier than the table.
- Editorial admission: no sea-surface temperature series and no visitor, occupancy or price series were read for this page, so none is quoted. Seasonal opening hours change · check operators when you book.