
DRY TORTUGAS · BEST TIME TO VISIT · 70 MILES WEST OF KEY WEST
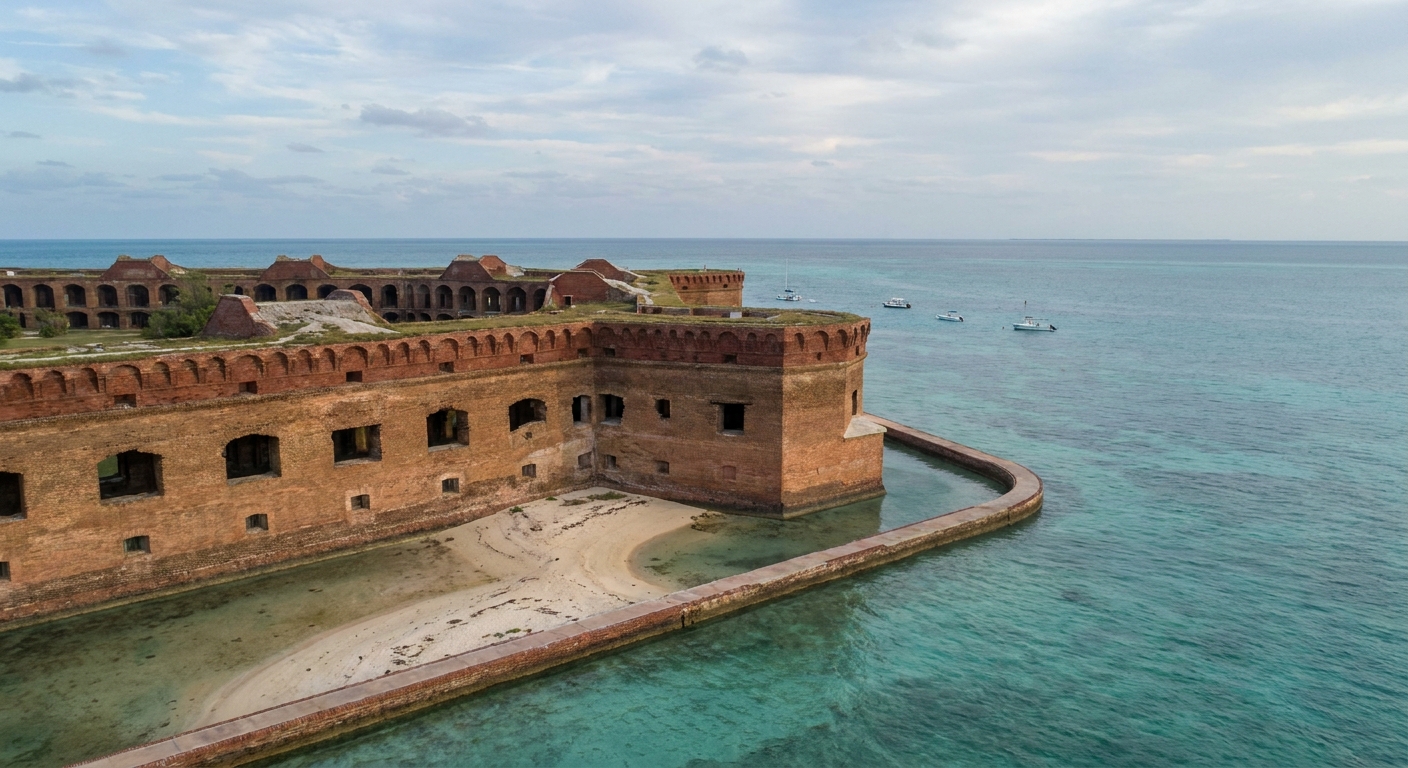
Most Florida trips survive a bad month. This one does not: Dry Tortugas is a fort, a beach and a reef on a speck of sand, reached by boat across seventy miles of open Gulf, and the calendar decides what the day looks like from the moment you push off from Key West.
So this page picks a month and says why, with the twelve-month table underneath it. April takes the verdict at 82.6°F days and 2.07 inches of rain. September takes the warning at 7.24 inches. Everything in between is a trade you can see in numbers before you book.
THE YEAR AT A GLANCE · DRY TORTUGAS
Book April if you can choose freely: 82.6°F days, 2.07 inches of rain over 2.8 wet days, and a sea averaging 79.8°F, against September’s 7.24 inches and 10.2 wet days.
BEST MONTH: APRIL · DRIEST: MARCH, 1.53 IN · WETTEST: SEPTEMBER, 7.24 IN · AIR NORMALS MEASURED AT KEY WEST
Go for: April and November, when rain sits close to 2 inches, wet days stay near three, and the water is warm enough to snorkel without arguing about it.
Think twice before: committing fixed dates in September, the month that records 10.2 days with at least a tenth of an inch of rain and 1.9 days with an inch or more.
Air: NOAA NCEI 1991-2020 normals, Key West station · Sea: Open-Meteo Marine, 2015-2024 · Daylight: sunrise-sunset.org · full sources at the end
On this page
- Dry Tortugas weather in every monthThe 12-month table: highs, rain, wet days, sea
- The single best month to goApril, at 82.6°F and 2.07 inches
- Water warm enough to snorkelSea from 76.3°F in February to 88.8°F in August
- The quietest stretch of the yearLate August through October, inside hurricane season
- The month to keep off the calendarSeptember, 7.24 inches and 10.2 wet days
- Shoulder months worth bookingNovember and May, compared with April
One thing shapes every answer below. Once the boat drops you on Garden Key there is no indoor plan: the day is fort, sand, snorkel and the ride home, and the crossing back is the same seventy miles of open water. A month that reads as merely damp on a city guide reads as a canceled day trip out here.
Dry Tortugas weather month by month: highs, lows, rain and sea
| Month | Avg high | Avg low | Rain | Days ≥0.10 in | Sea (avg daily max) |
|---|---|---|---|---|---|
| January | 75.8°F | 65.5°F | 1.83 in | 3.3 | 76.5°F |
| February | 77.4°F | 67.1°F | 1.54 in | 2.4 | 76.3°F |
| March | 79.6°F | 69.3°F | 1.53 in | 2.9 | 78.6°F |
| April | 82.6°F | 73.1°F | 2.07 in | 2.8 | 79.8°F |
| May | 85.9°F | 76.4°F | 3.12 in | 4.1 | 84.6°F |
| June | 88.7°F | 79.4°F | 4.23 in | 6.4 | 86.6°F |
| July | 90.2°F | 80.6°F | 3.63 in | 6.8 | 88.7°F |
| August | 90.6°F | 80.5°F | 5.37 in | 9.1 | 88.8°F |
| September | 89.0°F | 79.2°F | 7.24 in | 10.2 | 88.3°F |
| October | 85.8°F | 76.8°F | 5.67 in | 7.6 | 84.2°F |
| November | 81.0°F | 72.2°F | 2.05 in | 3.0 | 81.2°F |
| December | 77.7°F | 68.3°F | 2.16 in | 3.1 | 77.6°F |
November through April is the dry half of the year: highs of 75.8°F to 82.6°F, and monthly rain that never leaves the band between 1.53 and 2.16 inches. June through October is the wet half: highs of 85.8°F to 90.6°F, and rain running from 3.63 inches in July to 7.24 inches in September.
May and November are the hinges. April’s 2.07 inches become 3.12 inches in May, wet days go from 2.8 to 4.1, and the sea gains 4.8°F, from 79.8°F to 84.6°F. The sharpest swing of the twelve runs the other way in fall: October’s 5.67 inches drop to November’s 2.05, a fall of 3.62 inches, with wet days cut from 7.6 to 3.0.
September is the hardest month of the twelve for anyone camping on Garden Key, with 7.24 inches of rain, 10.2 days recording at least a tenth of an inch, and 1.9 days recording a full inch or more. Nothing cools off after dark either, since the average September low is 79.2°F. Day-trippers can rebook a wet Tuesday. A tent, ferried out with you, cannot.
Every air figure here comes from NOAA’s 1991-2020 normals for station USW00012836, and that thermometer stands at Key West, seventy miles east. Dry Tortugas sits alone in open Gulf, windier, with nothing between it and the weather, so treat the highs and the rain as the regional pattern rather than as a reading taken at the fort. The sea column has a different origin: the Open-Meteo marine series, averaged over 2015-2024.
When is the best time to visit Dry Tortugas?
April, without much hesitation. Highs average 82.6°F and lows 73.1°F, rain totals 2.07 inches spread over 2.8 days at a tenth of an inch or more, the water averages 79.8°F, and April 15 delivers 12 hours 47 minutes of daylight. That combination gives you a warm crossing, a swimmable reef and enough hours ashore to use both.
March is drier, 1.53 inches against April’s 2.07, and holds wet days almost level at 2.9. What March lacks is water and light: the sea averages 78.6°F, and March 15 runs 44 minutes shorter than April 15. Going the other way, May buys a much warmer sea, 84.6°F, by adding a full inch of rain and 1.3 more wet days.
The practical half of an April trip happens seventy miles east. Boats and seaplanes leave from town, so read our Key West guide for beds and the night before, see where the park fits among Florida’s national parks, and check the statewide dry season if this island is one stop in a longer Florida route.
When can you swim in Dry Tortugas? Sea temperature month by month
Seven months clear the 80°F mark most swimmers treat as no-wetsuit water: May at 84.6°F, June 86.6°F, July 88.7°F, August 88.8°F, September 88.3°F, October 84.2°F and November 81.2°F. The remaining five stay under it, and not by much: April 79.8°F, March 78.6°F, December 77.6°F, January 76.5°F, February 76.3°F. Even February, the coolest of the twelve, is warmer than most American beaches manage in August.
Read those numbers as afternoon numbers. Each one is an average of DAILY MAXIMA over 2015-2024, not a mean across 24 hours, so it sits a shade above the water you meet on a morning snorkel, which is usually when the boat drops you. Add the wind, because there is nothing upwind of this island to break it, and a February swimmer coming out at 76.3°F gets a colder minute than the figure suggests.
When is Dry Tortugas quietest?
The calendar marks the low stretch, and it runs from late August, when American school terms restart, through October. It sits inside the Atlantic hurricane season, June 1 to November 30 (dates and the seasonal pattern in our Florida guide), and it carries the two wettest months on the table: September at 7.24 inches, October at 5.67.
What that buys is water and hours. August averages 88.8°F at the surface and September 88.3°F, the two warmest readings of the year, so snorkeling over the coral heads stops being a question of tolerance. Daylight still holds up in early fall too, 12 hours 19 minutes on September 15, against 10 hours 49 minutes on January 15.
What it costs is certainty about your dates. September records rain of a tenth of an inch or more on 10.2 days, roughly one day in three, and August is right behind at 9.1. Seventy miles of exposed Gulf separate Garden Key from Key West with nothing sheltering the route, and a storm sitting offshore reaches your booking long before it reaches the island.
Which month should you avoid in Dry Tortugas?
September, and mainly for two groups: campers, and anyone flying in on dates that cannot move. Its 7.24 inches of rain is nearly five times March’s 1.53, the heat holds at 89.0°F by day, and the average low of 79.2°F gives back nothing at night on a sand island with no shade after the fort closes its shadow.
It is not a write-off, though. About 20 days in an average September record less than a tenth of an inch, so the wet total is concentrated rather than spread: 1.9 of those days carry an inch or more on their own. The reward for gambling is a sea at 88.3°F and a park with the fewest fixed-date visitors of the year. The relief afterward is slow, since October still measures 5.67 inches.
Is the shoulder season worth it in Dry Tortugas?
Two months do shoulder duty here: November and May. November lands within two hundredths of an inch of April, 2.05 against 2.07, with 3.0 wet days against 2.8 and highs of 81.0°F. May is the looser bookend, 3.12 inches over 4.1 wet days, with highs of 85.9°F and lows of 76.4°F.
Both beat April in the water. November averages 81.2°F at the surface, 1.4°F above April, and it is the last month of the year over the 80°F line. May averages 84.6°F, a 4.8°F jump on April, and May 15 adds 36 minutes of daylight over April 15, for 13 hours 23 minutes.
The bill comes due in different currencies. November 15 carries 10 hours 59 minutes of daylight, one hour 48 minutes less than April 15, which shortens a day trip at both ends. May pays in rain instead: a full inch more than April, 1.3 extra wet days, and nights that stop cooling below 76.4°F.
Take November. Rain and wet days are essentially April’s, the sea is warmer than April’s, and the only real loss is daylight you can plan around by taking the first boat out. Choose May over it in one case: you came to be in the water all day and want 84.6°F rather than 81.2°F.
The last word
Pick April, settle for November, and treat September as a gamble you make with refundable money. One number stays out of every argument above: December 15 gives 10 hours 40 minutes of daylight, the shortest day of the Dry Tortugas year, and a crossing eats the same two chunks out of it that it eats in June. On the winter boat, the fort tour and the snorkel compete for the same short afternoon.
Sources & data for this guide
- Monthly air normals, 1991-2020, station USW00012836 at Key West · NOAA NCEI · checked Sep 12, 2026
- Rain-day counts at 0.10 inch and 1.00 inch thresholds · NOAA NCEI 1991-2020 normals · checked Sep 12, 2026
- Sea surface temperatures, mean of daily maxima 2015-2024 · Open-Meteo Marine API · checked Sep 12, 2026
- Daylight length and sunrise/sunset on the 15th of each month · sunrise-sunset.org · checked Sep 12, 2026
- Atlantic hurricane season dates, June 1 to November 30 · NOAA, via our Florida guide · checked Sep 12, 2026
- Editorial admission: the air normals are measured seventy miles east at Key West, not at Garden Key, and we read no monthly visitor counts or ferry fares for this page · boat and seaplane schedules change, check the operator when you book.