
MIAMI · BEST TIME TO VISIT · NOAA 1991-2020
Miami sells one picture all year: palms, warm water, no jacket. It delivers that picture twice, in two different cities. From December through April the air dries out, highs sit between 76.2°F and 83.6°F, and rain shows up on fewer than five days a month. From June through October the same streets run highs near 90°F, humidity in the high 80s, an afternoon storm on the schedule and the Atlantic hurricane season overhead until November 30.
Warmth is not the variable here. Rain, humidity, storm risk and company are, and they swing hard: 1.83 inches of rain in January against 10.51 in June at the airport gauge. Each of the twelve months has its own guide with the fine print, from January‘s dry cool to September‘s storm watch. The verdicts below choose between them.
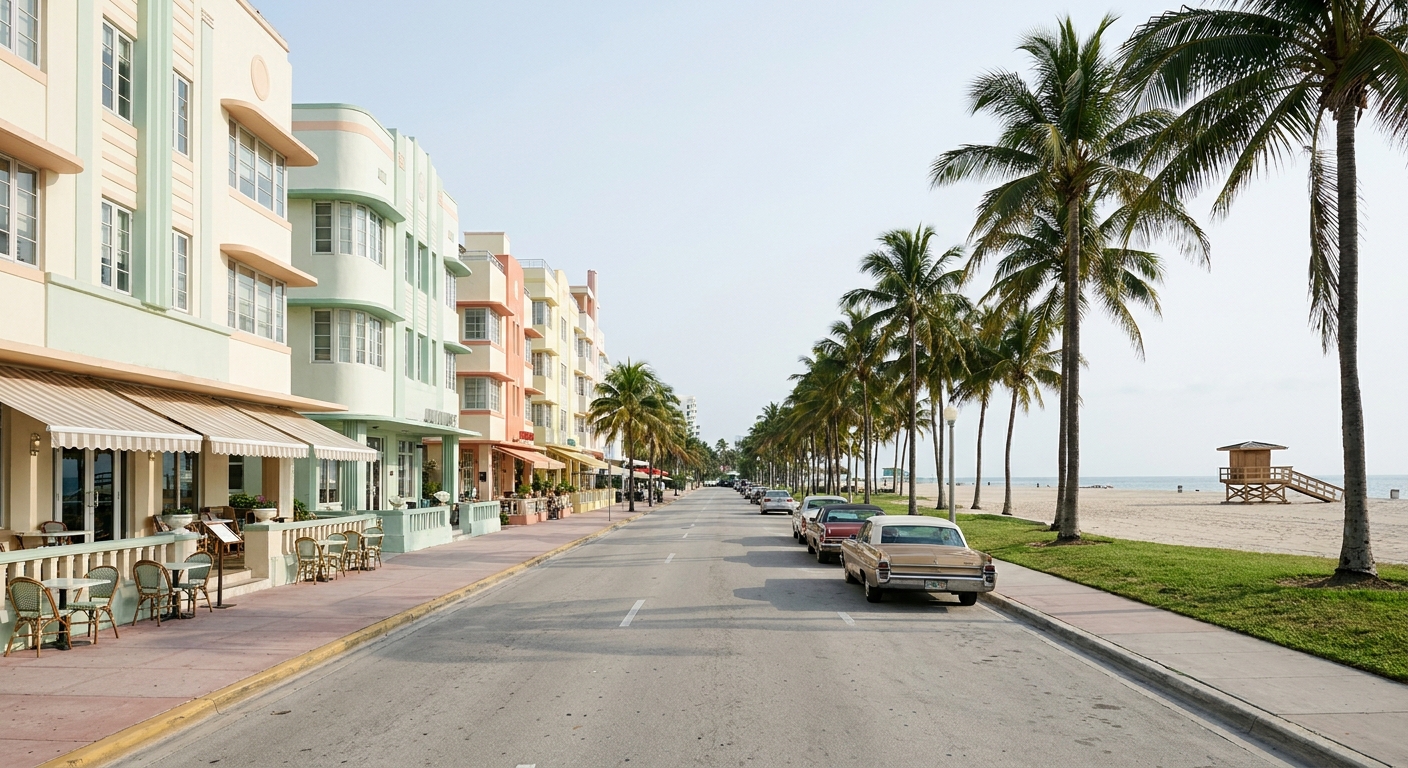
THE YEAR AT A GLANCE · MIAMI
Go in April: 83.6°F days, 3.36 inches of rain over 4.3 wet days and water at 79.6°F, with spring break’s apparatus packed up and hurricane season still two months out.
BEST: APRIL · DRIEST: JANUARY · QUIETEST: AUG TO OCT · SKIP: SEPTEMBER
Go for: December through April, when highs run 76°F to 84°F, wet days stay under five a month, and the sea never drops below 76.9°F.
Think twice before: booking September non-refundable: the Atlantic season peaks on September 10 and the gauge logs 10.22 inches across 13.1 wet days.
Normals: NOAA NCEI 1991-2020, station USW00012839 · Sea: Open-Meteo Marine 2015-2024 · Hurricanes: NOAA NHC · full sources below
On this page
- Best month for a first Miami tripApril, 83.6°F and 4.3 wet days
- Sea temperature month by monthSeven months above 80°F
- The quiet months in MiamiAugust to October
- The month to skipSeptember, 10.22 inches of rain
- Weather normals for all twelve monthsHighs, lows, rain and sea, 1991-2020
- Shoulder season: November or MayNovember, with water at 81.7°F
Two calendars run the Miami year. Florida’s dry season is November through April statewide, and in South Florida the warm, dependably dry stretch runs December to April, roughly 65°F to 80°F. The second calendar is the Atlantic hurricane season, June 1 to November 30, with most activity between mid-August and mid-October. Nearly every timing decision in this city is a negotiation between those two, as the statewide view also finds.
Miami weather month by month: highs, lows, rain and sea
| Month | Avg high | Avg low | Rain | Days ≥ 0.10 in | Sea (avg daily max) |
|---|---|---|---|---|---|
| January | 76.2°F | 61.0°F | 1.83 in | 3.8 | 77.0°F |
| February | 78.2°F | 63.2°F | 2.15 in | 3.6 | 76.9°F |
| March | 80.6°F | 65.6°F | 2.46 in | 3.5 | 78.4°F |
| April | 83.6°F | 69.8°F | 3.36 in | 4.3 | 79.6°F |
| May | 86.7°F | 73.4°F | 6.32 in | 6.9 | 83.0°F |
| June | 89.3°F | 76.3°F | 10.51 in | 12.6 | 85.4°F |
| July | 90.6°F | 77.5°F | 7.36 in | 11.1 | 88.2°F |
| August | 90.7°F | 77.7°F | 9.58 in | 13.3 | 88.3°F |
| September | 89.0°F | 76.9°F | 10.22 in | 13.1 | 87.8°F |
| October | 85.9°F | 74.2°F | 7.65 in | 9.0 | 84.5°F |
| November | 81.3°F | 68.3°F | 3.53 in | 4.7 | 81.7°F |
| December | 78.2°F | 64.3°F | 2.44 in | 3.7 | 79.1°F |
The shape of the year is a long dry plateau and one tall wet dome. December through April each keep rain under 3.4 inches, while every month from May to October clears 6.3 inches. Daytime temperature barely bothers to move by comparison: 76.2°F in January to 90.7°F in August, a swing of 14.5 degrees across an entire year.
Two months do the flipping. May turns April’s 3.36 inches into 6.32, pushes wet days from 4.3 to 6.9, and warms the sea 3.4 degrees to 83.0°F. November runs the tape backwards: rain falls from October’s 7.65 inches to 3.53, wet days from 9.0 to 4.7, and the humidity finally releases the city. Between those two hinges Miami is either reliable or theatrical, with very little in between.
August is the hardest month for anyone planning to be outside on foot. Highs average 90.7°F, nights hold at 77.7°F, and 13.3 days log measurable rain, 2.9 of them an inch or more, with humidity between 85 and 90 percent. A pool day survives all that comfortably. Wynwood murals, Little Havana coffee counters and a stroller do not, which the August guide and our family notes both spell out.
One caveat carries the whole table. Every figure here comes from NOAA’s 1991-2020 normals for station USW00012839, the gauge at Miami International Airport, about 12 miles inland from South Beach, and a wet day counts only if it reaches 0.10 inch. Sea readings come from elsewhere: Open-Meteo Marine, 2015-2024. A hotel a block from the Atlantic gets a breeze the runway apron never feels, so read those highs as a city measurement rather than a sunbathing one.
When is the best time to visit Miami?
April is the pick for an ordinary first trip. Highs average 83.6°F with lows at 69.8°F, so dinner stays outdoors without a sweater. Rain totals 3.36 inches across 4.3 wet days, the sea sits at 79.6°F, and April 15 gives about 12 hours 50 minutes of daylight, nearly two hours more than mid-November. Spring break’s machinery has been dismantled by then, and hurricane season is still two months off.
March runs 3 degrees cooler and genuinely drier, 2.46 inches over 3.5 wet days, the lowest count of the year. Its calendar is the objection. In 2027 the Miami Open holds Hard Rock Stadium March 14 to 28 and Ultra takes Bayfront Park March 26 to 28, overlapping by three days, while Miami Beach runs a traffic plan from 6 p.m. Thursday through Sunday. In 2026 that meant Art Deco garages on $40 to $100 flat rates and a $548 non-resident tow.
The fine print sits on the month’s own page: the April guide covers what those 4.3 wet days look like in practice, when the sand fills up, and where to base without a car. If the March calendar matters to you more than 0.9 inch of extra rain, March has its own page too.
When can you swim in Miami? Sea temperature month by month
Set the swimming line at 80°F, our editorial bar rather than a measurement, and seven months clear it: May at 83.0°F, June 85.4, July 88.2, August 88.3, September 87.8, October 84.5, November 81.7. Five months fall below, and not by much. February is the year’s coolest water at 76.9°F, with January at 77.0, March 78.4, December 79.1 and April 79.6. Nobody flees the Atlantic in February. They just notice the first ten seconds.
The measurement nuance matters more than the decimals. Those sea figures are averages of daily maxima over 2015-2024, so they run a shade above a 24-hour mean, and they describe offshore surface water rather than the shin-deep shallows at Lummus Park. Swim at 7 a.m. and you are under the number; swim at 4 p.m. in August and you may wonder why the ocean feels like a bath.
When is Miami quietest?
Miami’s quiet stretch is August through October, and the calendar says so before any rate does. School is back, the wet season still has three months to run, and the Atlantic season hits its statistical peak on September 10, with most activity between mid-August and mid-October. The hotel market follows that shape: rates run lowest August to October and highest February to April, which is market data rather than an official series.
What you gain is space and the warmest water of the year. The sea averages 88.3°F in August, its annual high, and 87.8°F in September. Lummus Park, the free 24-hour beach fronting Ocean Drive between 5th and 15th, keeps its lifeguards and finds you room. Crandon Park on Key Biscayne asks $7 to park on weekdays against $10 at weekends. The Perez Art Museum is free Thursdays 5 to 9 p.m., which lands neatly after the afternoon storm.
What you lose is the reason nobody charges peak rates. August logs 13.3 wet days, September 13.1 with 3.3 of them at an inch or more, and September’s 10.22 inches nearly match June’s annual record of 10.51. Two costs refuse to soften with the season: Miami-Dade’s 6 percent transient rental tax on top of the 6 percent state sales tax, and Miami Beach resort fees, published anywhere from about $25 on average up to $35 to $95 a night by property.
Which month should you avoid in Miami?
If one month has to go, make it September, and be clear about whom it hurts. A traveler locked to fixed dates, non-refundable bookings and an outdoor itinerary is buying the peak of the Atlantic season on September 10, plus 10.22 inches of rain across 13.1 wet days, highs of 89.0°F and nights that stay at 76.9°F. Someone flexible, refundable and happy by a pool is buying a different September altogether.
The month does repay the people who show up. Water at 87.8°F, sand that belongs to whoever wants it, and indoor Miami at full strength: Vizcaya in Coconut Grove opens Wednesday to Monday from 9:30 a.m. with last admission at 4:30 and $20 adult tickets during restoration work, closed Tuesdays, and the free Metromover circles Downtown and Brickell every 90 seconds at rush hour. The September guide handles the storm-watch practicalities.
Is the shoulder season worth it in Miami?
Miami’s shoulders are November on one side and May on the other, hugging the December-to-April window and the February-to-April peak. November averages highs of 81.3°F, lows of 68.3°F, 3.53 inches of rain over 4.7 wet days and a sea surface of 81.7°F. Measured against March, a full peak-season month, that is 0.7 degrees warmer by day, 3.3 degrees warmer in the water and only 1.2 more wet days.
November’s water beats every month of the February-to-April peak, by 2.1 degrees over April’s 79.6°F and by 4.8 over February’s 76.9°F. No traffic plan, no Ultra weekend, no flat-rate garage. Beaches in mid-November behave like beaches rather than venues, and hotel rates are not yet on their February-to-April climb.
It takes back daylight and certainty. November 15 gives about 10 hours 55 minutes of light against 12 hours 50 on April 15, an hour and 55 minutes less, with the sun down at 5:33 p.m. Eastern. The month also sits inside hurricane season until the 30th. May’s cost is water of another kind: 6.32 inches over 6.9 wet days, against April’s 3.36 over 4.3.
Split the decision by what you came for. Beach-first trip: November, warm sea, short evenings. Walking trip from Wynwood to Little Havana: April, long light and 4.3 wet days. May deserves the ticket only if 83.0°F water is the whole point and a 4 p.m. downpour is survivable. Detail waits in November and May.
The last word
Book inside the dry season and stop optimizing. If the week has to be bulletproof, January is the closest Miami comes to a promise: 1.83 inches of rain for the entire month and an average of just 0.4 days reaching an inch, with 61.0°F nights as the invoice. Then ride the free Miami Beach trolley, 8 a.m. to 11 p.m. daily on five routes, and put the parking money into dinner in Little Havana.
Sources & data for this guide
- Monthly normals, highs, lows, rain and wet-day counts · NOAA NCEI 1991-2020, station USW00012839 (Miami International Airport) · checked Sep 10, 2026
- Sea surface temperature, mean of daily maxima 2015-2024 · Open-Meteo Marine API · checked Sep 10, 2026
- Hurricane season dates and the September 10 peak · NOAA National Hurricane Center · checked Sep 10, 2026
- Daylight and sunset times, 15th of each month · sunrise-sunset.org · checked Sep 10, 2026
- Spring break parking, towing and traffic measures · City of Miami Beach relayed by NBC 6 and CBS News Miami, 2026 program · checked Sep 10, 2026 · the city republishes each winter, so treat the 2026 figures as the pattern and not as 2027 prices
- Hotel rate seasonality, lowest August to October and highest February to April · market data relayed by local guides · checked Sep 10, 2026 · a trend, not an official statistic
- Vizcaya hours and admission · vizcaya.org · checked Sep 10, 2026 · Perez Art Museum free hours · pamm.org · checked Sep 10, 2026
- Metromover, Metrorail fares and Miami Beach trolley · Miami-Dade County and City of Miami Beach · checked Sep 10, 2026 · published Metromover hours differ between sources
- Beach parking rates and lodging taxes · Miami-Dade Parks, City of Miami Beach, Florida Department of Revenue form DR-15TDT · checked Sep 10, 2026
- The 80°F swim line is our editorial threshold, not a measurement, and resort-fee amounts diverge widely by source · verdicts are ours.