
FANNING SPRINGS · NORTH FLORIDA · THE 12-MONTH VERDICT
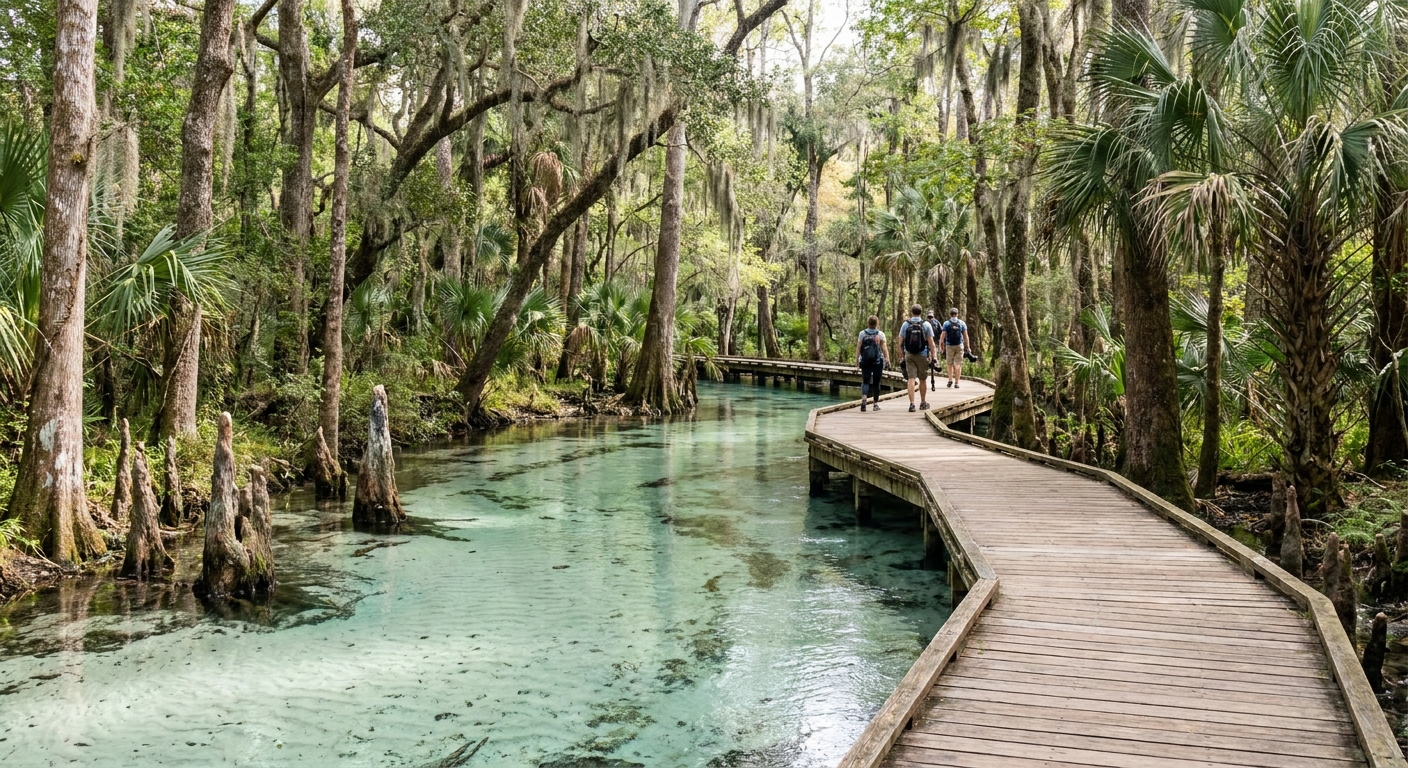
Fanning Springs sits where a spring run meets the Suwannee River, and most people arrive with one question: which month is worth the drive? The thermometer answers only half of it. The pool itself holds its temperature all year, while the air above it swings from January nights averaging 41.8°F to July afternoons averaging 90.1°F.
One set of numbers runs through everything below: the 1991-2020 official normals from Cross City AP, the nearest reporting station, about 44 km (27 miles) away. They measure air over an airfield, not water in the run. Used for what they are, they settle a trip: when the swim is comfortable, which weeks are thin, and the month that will soak a week booked six months out.
THE YEAR AT A GLANCE · FANNING SPRINGS
April is the all-round pick at 80.1°F highs and 4.1 wet days, October and November are the driest weeks of the twelve months, and August is the month that soaks a fixed itinerary.
BEST: APRIL, THEN OCTOBER · AVOID: AUGUST · NORMALS 1991–2020 · AIR, NOT WATER
Go for: a spring swim that works in any month, dry-ground trail days from October to November, and school-term mornings with room in the parking lot.
Think twice before: locking a non-refundable week in June, July or August, when the station records 9.1 to 11.6 days of measurable rain per month.
Normals: NOAA NCEI 1991-2020, Cross City AP · Daylight: sunrise-sunset.org · full sources at the end
On this page
- Month-by-month highs, lows and rain daysThe 12-month table
- The single best month to bookApril: 80.1°F, 4.1 wet days
- How hot a July trip really isHighs of 90.1°F, nights at 72.5°F
- The quietest weeks of the yearSchool-term weekdays, November to February
- Which month to avoid with kidsAugust: 8.10 inches of rain
- Is October better than April?October: 82.2°F, 3.7 wet days
For a weekend that has to be booked in advance, April carries the best odds of the year: 4.1 days of measurable rain and afternoons at 80.1°F. If the swim matters less than the walking, the picnic and an empty parking lot, November is drier still, at 2.10 inches across 3.4 wet days.
Fanning Springs weather month by month: highs, lows and rainfall
| Month | Avg high | Avg low | Rain | Days ≥0.10 in | Daylight (15th) |
|---|---|---|---|---|---|
| January | 65.9°F | 41.8°F | 3.38 in | 5.7 | 10h 30m |
| February | 69.6°F | 45.2°F | 2.96 in | 4.8 | 11h 12m |
| March | 74.9°F | 49.6°F | 3.53 in | 4.6 | 12h 02m |
| April | 80.1°F | 55.0°F | 2.90 in | 4.1 | 12h 57m |
| May | 86.7°F | 62.7°F | 2.74 in | 4.7 | 13h 42m |
| June | 89.5°F | 70.6°F | 7.00 in | 9.1 | 14h 05m |
| July | 90.1°F | 72.5°F | 7.77 in | 11.6 | 13h 54m |
| August | 89.9°F | 72.9°F | 8.10 in | 11.5 | 13h 14m |
| September | 88.0°F | 69.8°F | 5.82 in | 7.6 | 12h 22m |
| October | 82.2°F | 59.9°F | 2.23 in | 3.7 | 11h 30m |
| November | 74.4°F | 49.2°F | 2.10 in | 3.4 | 10h 42m |
| December | 68.2°F | 44.4°F | 2.95 in | 4.6 | 10h 18m |
Temperature frames the year loosely, from 65.9°F highs in January to 90.1°F in July, but rain draws the sharp line: 8.10 inches in August against 2.10 in November. The twelve months split into a wet dome from June through September and a dry, mild remainder that covers two thirds of the calendar.
June is where the switch happens. May records 2.74 inches over 4.7 wet days; June jumps to 7.00 inches over 9.1, with 2.0 days reaching an inch or more. The return trip runs through October: September still averages 5.82 inches and 7.6 wet days, then October drops to 2.23 inches and 3.7.
August is the month that punishes a locked plan, with 8.10 inches of rain, 11.5 days at 0.10 inch or more, 2.4 of them at an inch or more, and nights averaging 72.9°F. For a family that paid for a week in advance, those figures cost real days. For anyone with a free Tuesday morning and a towel in the car, they cost nothing at all.
Every figure here comes from the NOAA 1991-2020 monthly normals recorded at Cross City AP, roughly 44 km (27 miles) from the spring, and every one of them measures the air: temperature, precipitation totals, and counts of days crossing 0.10 inch and 1 inch. The water in the run has no season, so a January swim is a question of air temperature on the walk back to the car, not of the pool. A published water-temperature normal for the spring itself was not available in this dataset, so no figure for it is quoted.
When is the best time to visit Fanning Springs?
April is the answer for most visitors: highs of 80.1°F, lows of 55.0°F, 2.90 inches of rain spread across 4.1 wet days, and 12 hours 57 minutes of daylight on the 15th. Freezing nights are finished by then, at 0.1 night in an average April, so nothing forces an early exit from the water.
May afternoons run 6.6°F hotter (86.7°F) and May nights 7.7°F warmer (62.7°F), while the wet-day count barely moves, 4.7 against 4.1. March goes the other way: 74.9°F highs, 3.53 inches of rain, and 2.0 nights at or below 32°F, which turns the walk from the water into the memorable part of the day.
The state-wide frame behind that choice is the dry season, November through April, laid out in our Florida calendar. An April trip out here also pairs cleanly with a wider loop: a morning in the run, then St. Augustine or the Gulf coast later in the week, with the driving in the road-trip guide. Weekends fill before weekdays, so an ordinary April Wednesday is the quietest version of the best month.
How hot does Fanning Springs get in summer?
Summer afternoons sit in a narrow band: 89.5°F in June, 90.1°F in July, 89.9°F in August. Nights are the part visitors underestimate, with average lows of 70.6°F, 72.5°F and 72.9°F against 55.0°F in April. Between mid-June and mid-July the sun is up for just under 14 hours, giving the heat the whole day to build.
These normals carry temperature and precipitation and nothing else: no humidity, no dew point, no heat index. Any “feels like 103°F” number would be invented, so none appears here. What the data does support is the shape of a July day at the spring: a high near 90°F, rain on 11.6 days of the month, and water in the run that reads the same in July as in January.
When is Fanning Springs quietest?
The thin weeks are a school-calendar fact rather than a weather one: late September into mid-November, then January through early March, holiday weeks excepted. Weekday mornings beat weekend afternoons in every one of those months. November backs the calendar up with the driest air of the year, 2.10 inches over 3.4 wet days.
Visit then and you get room in the swimming area, gaps in the parking lot, and, in the coldest stretches, the reason north Florida spring runs matter in winter: manatees move up out of the cooling river, as our manatee guide explains. Mid-November still delivers 10 hours 42 minutes of daylight, enough for a morning swim and an afternoon on the river trail.
What you give up is light and a comfortable exit from the water. December 15 carries 10 hours 18 minutes of daylight against 14 hours 05 minutes on June 15, nearly four hours less. January averages 41.8°F at night with 8.5 nights at or below 32°F, and 5.7 wet days, the highest wet-day count of any month outside June to September.
Which month should you avoid at Fanning Springs?
August is the month to skip when your dates are fixed: 8.10 inches of rain, 11.5 days at 0.10 inch or more, 2.4 of them at an inch or more, and nights that average 72.9°F. Add the Atlantic hurricane season, June 1 to November 30 with its statistical peak around September 10, as the Florida calendar sets out, and a non-refundable late-summer week becomes a wager. A local driving out for one opportunistic morning has no such problem.
Roughly nineteen days in an average August still record less than 0.10 inch of rain, and the storms that do arrive are afternoon business. August also holds 13 hours 14 minutes of daylight on the 15th, room enough to be in the water by nine and back at the picnic table before the clouds stack up.
Is the shoulder season worth it at Fanning Springs?
October and November are the shoulder on this side of the year, with March on the other. October averages 82.2°F against July’s 90.1°F, a gap of 7.9°F, and 2.23 inches of rain against August’s 8.10. Wet days fall from 11.5 in August to 3.7 in October and 3.4 in November.
October lows of 59.9°F and 3.7 wet days make midday at the picnic tables workable in a way July’s 11.6 wet days do not, the ground on the river trails stays firm, and 11 hours 30 minutes of daylight on October 15 leaves an afternoon after the swim. School-term weekdays do the rest.
The water is unchanged; the exit from it is not. November averages 49.2°F at night with 2.0 freezing nights, and daylight shrinks from 13 hours 14 minutes in mid-August to 11 hours 30 minutes in mid-October, 1 hour 44 minutes less. Late swims stop being realistic well before Thanksgiving.
Verdict: when the swim is the point of the trip, take April first and October second, both at 4.1 wet days or fewer with afternoons in the 80.1 to 82.2°F band. When the trip is really a drive, a trail and a picnic with the swim as a bonus, November wins on 2.10 inches and 3.4 wet days, and you accept 10 hours 42 minutes of daylight as the price.
The last word
Book April if you get one weekend a year and want every hour to work, and take the second week of November if you would rather have the run to yourself. One figure settles it for the undecided: October and November each average 0.4 day with an inch or more of rain, the lowest count of the twelve months, against 2.5 in July. Whichever month you pick, get there before mid-morning, because the parking lot fills long before the water does.
Sources & data for this guide
- Monthly highs, lows, precipitation, wet-day and freeze-night counts · NOAA NCEI monthly normals 1991-2020, station USW00012833, Cross City AP, FL · checked Sep 12, 2026
- Daylight, sunrise and sunset for the 15th of each month · sunrise-sunset.org, converted to local time · checked Sep 12, 2026
- Station distance: the normals are recorded about 44 km (27 miles) from the spring, and they measure air, not the spring run · editorial note
- Water temperature at the spring itself: no published normal was available in this dataset, so none is quoted above
- Hurricane season dates and the September 10 peak · NOAA National Hurricane Center, via our Florida calendar · checked Sep 12, 2026
- Crowd timing is editorial: no attendance or ticketing series for this park was available · park hours and facilities change, check before you drive