
FLORIDA · TROY SPRING · WHEN TO GO
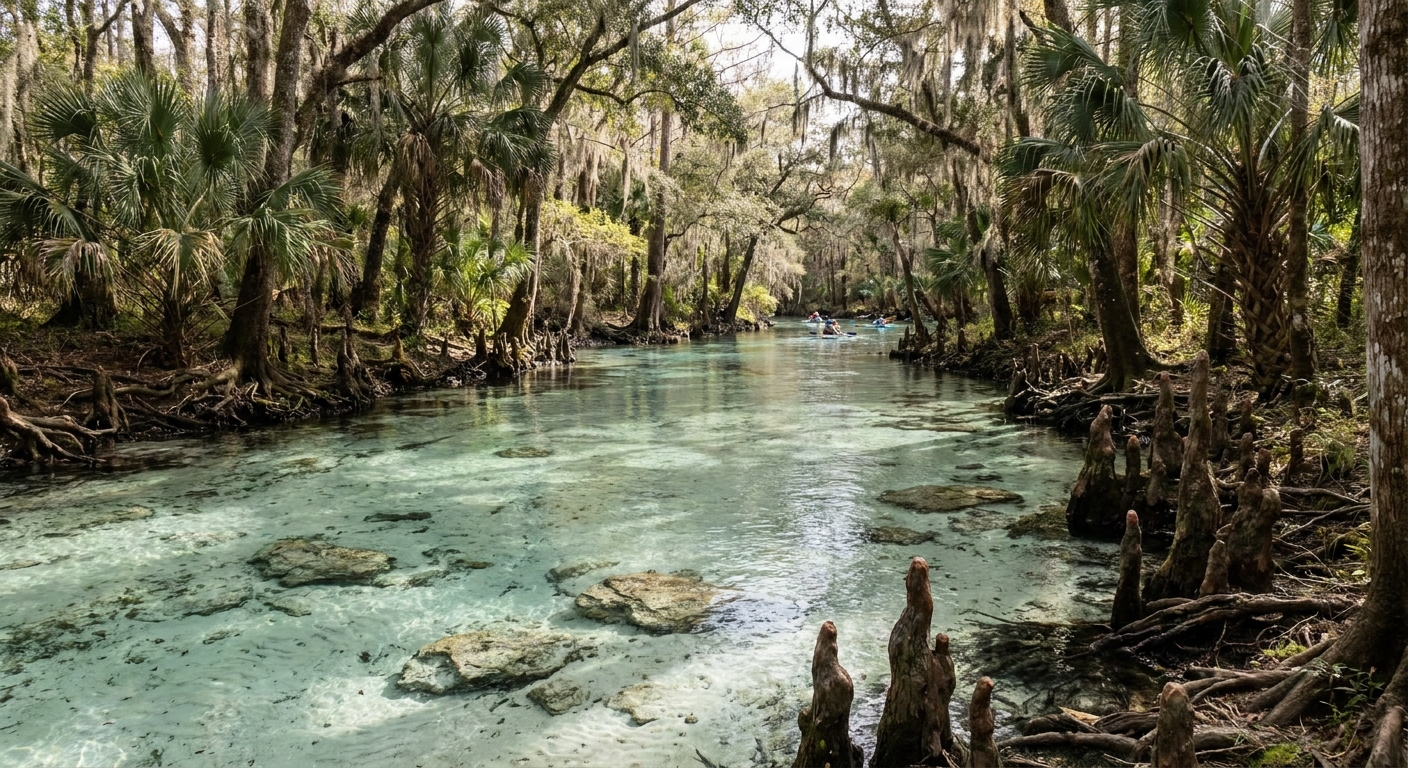
Troy Spring pushes out the same water in February that it pushes out in August. The air above it does all the moving: an average July afternoon at the nearest weather station reaches 90.1°F, an average January afternoon 65.9°F, a swing of 24.2 degrees over a basin that never changes.
So the timing question here is a question about everything except the swim. When do you want to sit on the bank afterward, when will an afternoon storm cut the day short, how much daylight is left for the drive home. Families, paddlers and anyone locking dates months ahead are choosing between a 3.7-wet-day October and an 11.6-wet-day July.
THE YEAR AT A GLANCE · TROY SPRING
October is the pick: 82.2°F afternoons, 2.23 inches of rain across 3.7 wet days, over water that runs the same in every month of the year.
AIR NORMALS 1991-2020 · CROSS CITY AP · 44 KM FROM THE SPRING
Go for: October and May, when afternoons sit in the 80s and rain risk runs near its annual floor, on a swim that never changes temperature.
Think twice before: booking a fixed July or August date far ahead: those months average 11.6 and 11.5 days with measurable rain.
Air normals: NOAA NCEI 1991-2020 · Daylight: sunrise-sunset.org · full sources at the end
On this page
- Month-by-month highs, lows and rainfallThe twelve-month table
- The best month overallOctober: 82.2°F, 2.23 inches
- Summer highs and night lowsJune to August, 89.5°F to 90.1°F
- The quietest weeks of the yearNovember to February weekdays
- The month to skip for a full day outdoorsJuly, with 11.6 wet days
- April and May compared with JulyThe shoulder trade in degrees and inches
The short version runs October first, May second, November third. July and August ask the most of a schedule and give back the longest evenings. Weekdays outside school vacation are the quiet end of every month, and nothing in the twelve-month record changes what the spring itself feels like when you get in.
Troy Spring weather month by month: highs, lows and rainfall
| Month | Avg high | Avg low | Rain | Days ≥ 0.10 in |
|---|---|---|---|---|
| January | 65.9°F | 41.8°F | 3.38 in | 5.7 |
| February | 69.6°F | 45.2°F | 2.96 in | 4.8 |
| March | 74.9°F | 49.6°F | 3.53 in | 4.6 |
| April | 80.1°F | 55.0°F | 2.90 in | 4.1 |
| May | 86.7°F | 62.7°F | 2.74 in | 4.7 |
| June | 89.5°F | 70.6°F | 7.00 in | 9.1 |
| July | 90.1°F | 72.5°F | 7.77 in | 11.6 |
| August | 89.9°F | 72.9°F | 8.10 in | 11.5 |
| September | 88.0°F | 69.8°F | 5.82 in | 7.6 |
| October | 82.2°F | 59.9°F | 2.23 in | 3.7 |
| November | 74.4°F | 49.2°F | 2.10 in | 3.4 |
| December | 68.2°F | 44.4°F | 2.95 in | 4.6 |
June through September take almost all of the year’s rain: 7.00, 7.77, 8.10 and 5.82 inches. Every other month stays under 3.60 inches, and five of them stay under 3.00. Afternoon highs climb from 65.9°F in January to 90.1°F in July and come back down the same staircase, while the lows do the harder work, from 41.8°F in January to 72.9°F in August.
May holds summer off, 86.7°F with 2.74 inches over 4.7 wet days, and then June jumps to 7.00 inches over 9.1. October runs that trade in reverse, cutting September’s 5.82 inches to 2.23 and its 7.6 wet days to 3.7 while the afternoon still reaches 82.2°F. Heat arrives before the rain and leaves after it, which is why those two months carry so much of the decision.
August posts the year’s worst set of figures for anyone who needs dry ground: 8.10 inches, 11.5 days with measurable rain, 2.4 of them over a full inch, and nights that stop falling at 72.9°F. That lands on campers, paddlers and photographers first, the visitors who need several dry hours in a row. A swimmer who drives in, gets wet and leaves by three barely registers it.
Every figure here comes from one source: NOAA’s 1991-2020 monthly normals for Cross City AP, about 44 km from the spring. They measure air, at an airport, not the water and not the shaded bank above it. The spring has no season of its own, and no official water-temperature series was read, so we quote no water number anywhere.
When is the best time to visit Troy Spring?
Take October. Afternoons average 82.2°F, mornings 59.9°F, and the month logs 2.23 inches of rain across 3.7 days with measurable precipitation, the second-lowest count of the twelve. On October 15 the sun is up from 7:33 a.m. to 7:02 p.m. local time, 11 hours 29 minutes, room for a morning swim, a long lunch and a drive that finishes in daylight.
November is drier still, 2.10 inches over 3.4 days, and that is the whole of its advantage. Its afternoons average 74.4°F, 7.8 degrees below October’s, it averages 2.0 nights at or below 32°F, and mid-November daylight runs 48 minutes shorter. Moving the other way costs more: September pours 5.82 inches, 3.59 inches more than October, over roughly twice as many wet days.
Statewide, Florida’s dry season is usually given as November through April, the window our Florida calendar is built around. A spring pulls that window a month earlier, because the air has to be warm enough to make getting out of the water pleasant. October also sits inside the Atlantic hurricane season, June 1 to November 30, and outside school vacation, so a Tuesday in October buys warm air and an uncrowded bank at once.
How hot does Troy Spring get in summer?
Summer afternoons hold a plateau: 89.5°F in June, 90.1°F in July, 89.9°F in August, a spread of six tenths of a degree across three months. The nights are the part travelers underestimate. Lows average 70.6, 72.5 and 72.9°F, so the air barely cools between one hot day and the next. Daylight peaks at 14 hours 07 minutes in mid-June, and on July 15 the sun works from 6:40 a.m. to 8:35 p.m. local time.
What the normals leave out matters here. This series carries no humidity, no dew point and no heat index, and an airport thermometer 44 km away measures nothing of the shade along a river bank. The shock of leaving 90°F air for a spring run is the reason people drive out in July, and we cannot put a figure on it, because no measured water temperature for Troy Spring was available.
When is Troy Spring quietest?
Crowds here follow the school calendar. The busy stretch is June to mid-August, plus the holiday weekends that bracket it and the spring-break weeks in March. The empty stretch is weekdays from November through February, away from Thanksgiving and Christmas week. No attendance series was read for this site, so nothing here ranks months by visitor count or by what a trip costs in one month against another.
The low-season trade reads well on the record. November averages 2.10 inches of rain over 3.4 days, the lowest pair of the year, and its afternoons still reach 74.4°F. December adds 2.95 inches over 4.6 days. The water has not shifted since August, so it is the same swim, with fewer people on the bank and a whole weekday to yourself.
You give it back in light and in mornings. December delivers 10 hours 16 minutes of daylight on the 15th, nearly four hours less than mid-June, with the sun down by 5:35 p.m. local. January averages 8.5 nights at or below 32°F, December 6.2, February 4.1. A January afternoon at 65.9°F sits 24.2 degrees below a July one, and at a 41.8°F dawn you want dry clothes and a towel waiting in the car.
Which month should you avoid at Troy Spring?
July is the month to skip when your dates are fixed months in advance. It averages 11.6 days with at least 0.10 inch of rain, more than any other month, 2.5 of them over a full inch, with afternoons at 90.1°F and nights that stop at 72.5°F. August is its near twin and wetter overall at 8.10 inches. Neither troubles a two-hour swim. Both trouble a day built around one long window outdoors.
Mid-July still gives 13 hours 56 minutes of daylight, with light past 8:30 p.m. local, so a storm can pass through and leave two usable hours behind it. Florida’s wet season runs on those afternoon storms statewide, as our state calendar sets out, and the water in the run is the same water you would swim in on a 65.9°F January day.
Is the shoulder season worth it at Troy Spring?
Call April and May one shoulder, September and October the other, around a June-to-August peak set by school vacation rather than by weather. April’s 80.1°F afternoons run 10.0 degrees below July’s. May closes most of that gap at 86.7°F, 3.4 degrees short of the July average, and September holds 88.0°F well after the school year has restarted.
April records 2.90 inches over 4.1 wet days against July’s 7.77 inches over 11.6, and May’s 2.74 inches are beaten only by November and October across the twelve months. That is 7.5 fewer wet days in April than in July, on a trip where one washed-out afternoon is the difference between a full day and a drive. The bank has room on a May weekday that June rarely offers.
You give up light and morning warmth. Mid-April runs 12 hours 58 minutes against mid-June’s 14 hours 07, an hour and nine minutes less, with the sun up from 7:02 a.m. to 8:00 p.m. local. April mornings average 55.0°F, 17.5 degrees below July’s, and April still logs 0.1 nights at or below 32°F in an average year.
For swimming, May takes the shoulder: 6.6 degrees warmer than April in the afternoon, 45 minutes more daylight on the 15th, and 2.74 inches of rain. For a full day outside with a packed lunch, April edges it, 4.1 wet days against 4.7 and mornings cool enough to walk in. September is the shoulder to leave alone, since its 88.0°F afternoons arrive with 5.82 inches of rain.
The last word
The choice is narrower than the twelve rows suggest: October if your dates move, May if they do not, July for the swim rather than for the day around it. March deserves a line of its own here, since it reads warm at 74.9°F with 12 hours 02 minutes of light on the 15th, sunrise 7:39 a.m. and sunset 7:41 p.m. local, and then carries 3.53 inches of rain, more than any month outside June to September, plus 2.0 nights at or below 32°F. Pack a fleece for the walk back to the car.
Sources & data for this guide
- Monthly air normals 1991-2020 for all twelve months, highs, lows and precipitation · NOAA NCEI, station USW00012833, Cross City AP, FL · checked Sep 13, 2026
- Days with 0.10 inch or more, days with 1 inch or more, and nights at or below 32°F · NOAA NCEI 1991-2020 normals · checked Sep 13, 2026
- Sunrise, sunset and daylight length on the 15th of each month, converted from UTC to local time · sunrise-sunset.org · checked Sep 13, 2026
- Atlantic hurricane season dates, June 1 to November 30 · NOAA National Hurricane Center · checked Sep 13, 2026
- Editorial admission: no water-temperature series and no attendance count were available for Troy Spring, so neither is quoted. The station measures air at an airport about 44 km from the spring; conditions on the bank and in the run will differ.