
CANCUN · THE 12-MONTH VERDICT · 21.2° N
Cancun sells one photograph all year: white sand, water the color of a swimming pool, a short flight from the United States. The calendar under that photograph is anything but flat. The same stretch of beach takes 1.29 inches of rain in an average March and 8.08 inches in an average September, and the sea between those two months climbs from 80.7°F to 86.0°F. Book the wrong week of vacation and you will spend a good part of it watching the afternoon from under a roof.
All twelve months average above 80°F at the sea surface, so the swimming rarely decides the dates. Rain and daylight do: 13 hours 27 minutes of light on June 15, down to 10 hours 54 minutes on December 15. Add the school-holiday blocks that fill the hotel zone and a single beach week has three moving parts. They do not peak together.
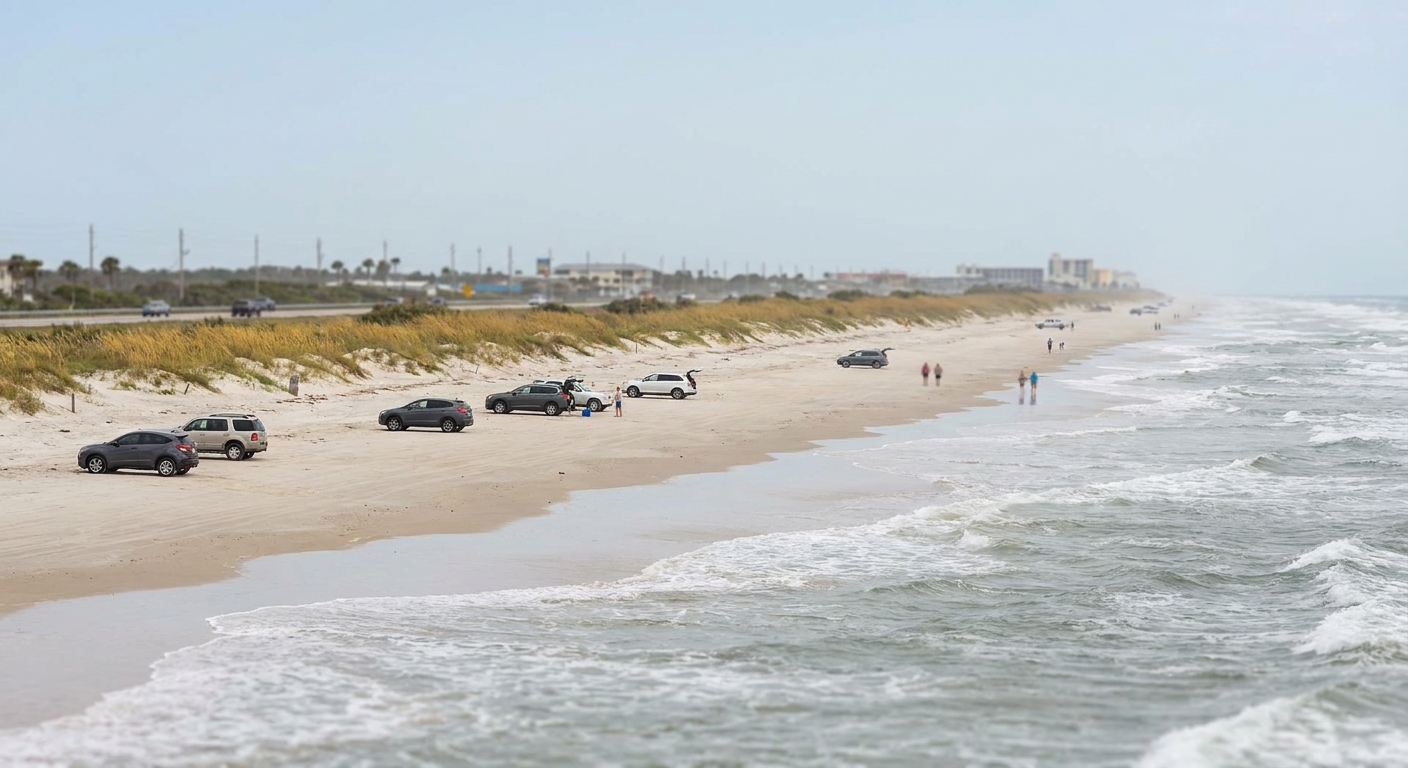
THE YEAR AT A GLANCE · CANCUN
March is the pick: 80.4°F afternoons, 1.29 inches of rain across 3.0 wet days, sea at 80.7°F. November is the warm-water alternative, and September is the month to plan around.
DRIEST: MARCH, 1.29 IN · WETTEST: SEPTEMBER, 8.08 IN · SEA ABOVE 80°F IN ALL TWELVE MONTHS
Go for: a beach week between December and April, when the wettest of those five months still drops under 2.5 inches and the sea never falls below 80.2°F.
Think twice before: booking September or October nights you cannot move: 18.7 and 15.0 days respectively record at least 0.10 inch of rain.
Air normals: ERA5 1991-2020 · Sea: Open-Meteo Marine 2015-2024 · full sources at the end
On this page
- The month-by-month tableHighs, lows, rain days and sea, all twelve months
- The best month overallMarch, 1.29 inches and 3.0 wet days
- Sea temperature for swimmingFrom 80.2°F in February to 86.0°F in September
- The quiet weeks on the calendarSeptember to early December, and late April into May
- The month to avoidSeptember, 8.08 inches over 18.7 wet days
- May or November for a shoulder tripWhat the shoulder gives and what it costs in rain days
Rain is the variable that moves most: 1.29 inches in March, 8.08 in September. The sea swings 5.8°F across the year and daylight two and a half hours, while the crowd follows the school calendar and ignores both. That is why two travelers can fly into the same airport, stay the same five nights, and come home with completely different reports.
Cancun weather month by month: highs, lows, rain and sea
| Month | Avg high | Avg low | Rain | Days ≥ 0.10 in | Sea |
|---|---|---|---|---|---|
| January | 77.7°F | 72.0°F | 2.41 in | 5.5 | 80.7°F |
| February | 79.0°F | 72.9°F | 1.43 in | 3.4 | 80.2°F |
| March | 80.4°F | 73.8°F | 1.29 in | 3.0 | 80.7°F |
| April | 82.8°F | 75.9°F | 1.48 in | 3.4 | 81.6°F |
| May | 84.3°F | 77.5°F | 3.58 in | 7.6 | 82.6°F |
| June | 84.6°F | 78.7°F | 6.59 in | 13.6 | 84.1°F |
| July | 85.7°F | 79.3°F | 4.41 in | 11.5 | 85.0°F |
| August | 85.8°F | 79.4°F | 5.75 in | 15.4 | 84.8°F |
| September | 84.7°F | 78.5°F | 8.08 in | 18.7 | 86.0°F |
| October | 82.6°F | 77.1°F | 7.62 in | 15.0 | 85.2°F |
| November | 80.2°F | 75.1°F | 3.18 in | 7.4 | 83.7°F |
| December | 78.7°F | 73.3°F | 2.10 in | 5.8 | 81.5°F |
The year splits cleanly into a dry half and a wet one. From November through April the wettest month is November at 3.18 inches; from May through October the driest is May at 3.58. Air temperature barely participates: only 8.1°F separates the coolest afternoons of the year, 77.7°F in January, from the warmest, 85.8°F in August.
May and November are the two months that flip the switch. May carries 3.58 inches over 7.6 days at 0.10 inch or more, against April’s 1.48 inches over 3.4 days. November runs the reverse and does it harder: 3.18 inches and 7.4 wet days after October’s 7.62 inches and 15.0, a fall of 4.44 inches and 7.6 wet days in one turn of the calendar, the sharpest of the twelve.
September is the punishing one, and it punishes a specific traveler: anyone whose days are built outdoors, on a boat, at a ruin, on a bike. It is the wettest month of the twelve, 8.08 inches of it, spread over 18.7 days recording at least 0.10 inch, with 0.8 days reaching an inch or more, on 12 hours 18 minutes of daylight at mid-month. Divers and long swimmers get the year’s warmest water in exactly those weeks, 86.0°F at the surface.
Every figure here is model output: ERA5 reanalysis, 1991-2020 normals computed for the grid cell centered on 21.17°N, 86.85°W. No airport gauge is involved. That cell sits over Cancun itself, on the Caribbean coast of Quintana Roo, and the inland Yucatán behind it runs hotter and drier, so these numbers travel badly once you drive west toward Valladolid. A wet day here means a calendar day that recorded 0.10 inch or more.
When is the best time to visit Cancun?
For a first trip of five to seven nights, book March. Afternoons average 80.4°F and nights 73.8°F, the month drops 1.29 inches of rain across 3.0 wet days, the driest total of the twelve, and the sea reads 80.7°F. Daylight on March 15 runs 12 hours 04 minutes, with sunrise at 6:54 a.m. and sunset at 6:58 p.m. local time (UTC-5, no clock change in Quintana Roo). You get a full beach day and a dinner outside on the same ticket.
February is the near miss and loses on all three counts: March runs 1.4°F warmer by day, 0.14 inch drier, and its sea surface reads 0.5°F higher, 80.7°F against 80.2°F. April is the other candidate, warmer still at 82.8°F, but it adds 0.19 inch of rain and lands squarely in the spring-break weeks that fill the hotel zone.
March fills early for exactly these reasons, so the booking decision matters more than the weather one: hold your nights well ahead and take midweek flights if the fares allow. If March does not fit your own calendar, compare warm-winter options month by month in our month-by-month planner, or see where Cancun sits against the rest of the field in the destinations index.
When can you swim in Cancun? Sea temperature month by month
Nothing in the year drops below 80°F at the surface. February is the floor at 80.2°F, January and March sit at 80.7°F, and the climb runs through April’s 81.6°F and May’s 82.6°F to the September peak of 86.0°F. October holds 85.2°F and November still reads 83.7°F, warmer than any month from January through May. In practice, the swimming window is all twelve, and what changes is whether the sky above it is open.
One caveat belongs with those numbers. Each is an average of daily maxima over 2015-2024, drawn from a marine model, so the true 24-hour average sits a shade lower and a 7 a.m. swim in February will feel cooler than 80.2°F suggests. The sea series also comes from a different source and a different period than the air normals above, which is worth remembering before comparing the two columns too closely.
When is Cancun quietest?
Quiet in Cancun is a school-calendar fact. The hotel zone fills for Christmas and New Year, for spring break in March, for Easter week, and for the northern summer holidays from late June through August. What remains is the low season: September and October, the first half of December ahead of the holidays, and the stretch from late April into May once spring break has cleared out.
Travelers who go then get room on the sand. September brings the warmest water of the year, 86.0°F, to the emptiest beach. Early December offers 78.7°F afternoons, 2.10 inches of rain across 5.8 wet days and a sea still at 81.5°F, with the holiday surge a fortnight away. These are also the weeks when a late booking stops being a gamble, and when a long weekend of three nights is worth the flight.
What you give up is dry ground and light. September records 18.7 days with at least 0.10 inch and October 15.0, against 3.0 in March. Daylight on October 15 runs 11 hours 42 minutes, an hour and three quarters shorter than mid-June, with the sun down by 6:23 p.m. Both months also fall inside the Atlantic hurricane season, and our sources carry no storm statistics, so read the cancellation terms as part of the itinerary.
Which month should you avoid in Cancun?
Avoid September if your trip depends on being outside it: a day trip inland, a full snorkel morning, a golf tee time, a wedding on the sand. The month is the wettest of the twelve at 8.08 inches, over 18.7 days at 0.10 inch or more. A family with one fixed week and a schedule of excursions is the reader who feels that. A couple with a pool, a book and flexible plans barely notices.
Something does redeem it. Most of that 8.08 inches falls as showers that pass: only 0.8 days in an average September record an inch or more. The sea hits its annual high of 86.0°F, the beach has gaps in it on a Saturday, and 12 hours 18 minutes of daylight on the 15th still leaves plenty of morning before the clouds gather.
Is the shoulder season worth it in Cancun?
The two shoulders are May and November. Measured against March, the peak of the dry season, May runs 3.9°F warmer by day at 84.3°F and carries 3.58 inches of rain over 7.6 wet days, against 1.29 inches over 3.0. November comes in cooler at 80.2°F, with 3.18 inches over 7.4 wet days. Neither sits inside a school holiday block, which is most of their appeal.
They give you water and light that March cannot. November’s sea reads 83.7°F against March’s 80.7°F, a full 3.0°F, which changes how long children stay in. May delivers 13 hours 12 minutes of daylight on the 15th, 68 minutes more than mid-March, with sunset at 7:19 p.m. and a sea of 82.6°F to swim in beforehand.
The cost is counted in wet days more than inches. May adds 4.6 days at 0.10 inch or more to March’s 3.0, November 4.4. And November has the shortest days of the four months in play, 11 hours 10 minutes on the 15th, 54 minutes less than March 15, with the sun gone by 6:06 p.m. and dinner eaten in the dark.
Take November. On a week of beach nights, a sea at 83.7°F and 7.4 wet days beat a sea at 80.7°F and 3.0 wet days for most families, and the early sunset costs you an evening hour you were spending at dinner anyway. May is the pick only if long light matters more to you than dry afternoons, because its 3.58 inches are the heaviest of the two.
The last word
Most of this decision comes down to one line: book March if you can choose, November if you want the warmer water and fewer people. If the school year pins you to summer, aim at July rather than August or June. July drops 4.41 inches against June’s 6.59 and August’s 5.75, and 11.5 wet days against 13.6 and 15.4, a dry notch sitting in the middle of the wet half that nothing in the brochures points out. Pack for showers, swim at 85.0°F, and stop negotiating with the calendar.
Sources & data for this guide
- Monthly air normals 1991-2020, highs, lows and precipitation · Open-Meteo / ECMWF ERA5 reanalysis, grid cell 21.1743N, 86.8466W · checked Sep 15, 2026 · model reanalysis, not an airport station record
- Wet-day counts at the 0.10 inch and 1 inch thresholds · same ERA5 series · checked Sep 15, 2026
- Sea surface temperatures, mean of daily maxima 2015-2024 · Open-Meteo Marine API · checked Sep 15, 2026 · different source and period from the air normals
- Daylight, sunrise and sunset on the 15th of each month · sunrise-sunset.org, converted to local time (UTC-5) · checked Sep 15, 2026
- Editorial admission: our sources carry no hurricane statistics, no visitor counts and no price series. The crowd and season notes here are read off the school and holiday calendar, and they are judgment, not measurement.