
SAYULITA · NAYARIT · SEPTEMBER
September in Sayulita comes with a Pacific that averages 89.0°F off the beach, afternoons that reach 94.3°F and nights that hold at 73.6°F. It is a month for long swims, slow breakfasts and a first surf lesson in water warm enough to stay in as long as your arms last.
The trade is rain. Mexico’s national weather service counts 22.1 days of measurable rain in an average September, and SECTUR’s calendar for the town lists no festival in the month. Dates that can move have October to consider, with 7.20 inches of precipitation against September’s 16.67. Dates that cannot move get a packing kit and a plan for wet days.
THE MONTH AT A GLANCE · SAYULITA
September gives Sayulita a sea of 89.0°F, warmer than August’s 88.8°F and October’s 87.6°F, and the price is rain on 22.1 days: go for the water, and move to October for drier days.
1991-2020 AIR NORMALS · SEA 2015-2024 · 22.1 RAIN DAYS · NO FESTIVAL ON SECTUR’S LIST
Go for: water at 89.0°F, a calendar with no festival to book around, and the chance to turn a wet afternoon into a long lunch.
Think twice before: planning a week of dry beach days. Measurable rain falls on 22.1 days in an average September.
Climate: SMN (CONAGUA) 1991-2020, station 18021 · Sea: Open-Meteo Marine API 2015-2024 · Daylight: sunrise-sunset.org · full sources below
On this page
- Sayulita weather in September94.3°F highs, 73.6°F lows and 22.1 rain days
- Can you swim in Sayulita in September?A sea at 89.0°F, and what we know about swell
- How busy is Sayulita in September?SECTUR’s event dates and the 5% lodging tax
- Things to do in Sayulita in SeptemberPlaya del Amor, the turtle camp and beginner surf
- Sayulita itinerary for SeptemberTwo days built around a 6:47 a.m. sunrise and wet-day swaps
- Sayulita in September vs August and OctoberHeat, rain and sea temperature across three months
- Is September a good time to visit Sayulita?Yes for warm water, no for dry beach days
Sayulita sits in the municipality of Bahia de Banderas and has been a Pueblo Mágico since December 3, 2015, a title renewed in August 2021. SECTUR names Puerto Vallarta International Airport and Tepic International Airport (TPQ) as the two air gateways to this stretch of Nayarit. For Sayulita weighed against other places in September, our when-to-go guides hold the comparison, and Destinations lists the rest of the map.
Sayulita weather in September
| September figure | Value | Source |
|---|---|---|
| Average high | 94.3°F | SMN station 18021, 1991-2020 normals |
| Average low | 73.6°F | SMN station 18021, 1991-2020 normals |
| Precipitation | 16.67 inches | SMN station 18021, 1991-2020 normals |
| Days of measurable rain | 22.1 | SMN’s own count |
| Sea surface (mean of daily maxima) | 89.0°F | Open-Meteo Marine API, 2015-2024 |
| Daylight on September 15 | 12 hours 17 minutes | sunrise-sunset.org |
Every figure here comes from Mexico’s national weather service, the Servicio Meteorologico Nacional (SMN), and its 1991-2020 normals for the Las Gaviotas station, number 18021. That is a measuring station, not a grid-cell reanalysis, but it stands about 19 miles east across Bahia de Banderas, and Sayulita’s beach town is not measured separately. Read the numbers as the nearest official ones for this coast. An average September reaches a high of 94.3°F, drops to a low of 73.6°F and collects 16.67 inches of precipitation.
SMN counts 22.1 days of measurable rain in an average September, roughly three days out of four. It does not publish the threshold for a rain day, and the count says nothing about the hour, so we cannot tell you whether those are quick showers or long soakers. Any plan that hinges on a dry stretch needs a backup under a roof: a lunch, a shop, a hammock.
The gap between the average high and the average low is 20.7 degrees, but even the low stays at 73.6°F, so nights never ask for a sweater. Pack light, breathable clothes, a rain shell, quick-dry swimwear, sandals that survive puddles and sunscreen for the 94.3°F afternoons.
Daylight on September 15 lasts about 12 hours 17 minutes. Sunrise falls at 12:47 UTC and sunset at 01:05 UTC, which in Bahia de Banderas time (America/Bahia_Banderas) reads as 6:47 a.m. and 7:05 p.m. Sunset drinks start early, and the walk home after dinner needs a phone flashlight.
Can you swim in Sayulita in September? Sea temperature
The sea off Sayulita averages 89.0°F in September. That figure is the mean of daily maxima over 2015-2024 from the Open-Meteo Marine API, so it runs a shade warmer than a 24-hour average would. It also comes from a different source and period than the air normals above, which is why the two are attributed separately.
At 89.0°F you walk in without a gasp and without a wetsuit. A thin rash guard is for the sun, not the chill. Rain on the surface changes nothing underneath, so a wet day is still a swimming day.
We hold no wind or swell figures for September, so we give no wave heights and no rip-current call. Conditions turn from one day to the next on this coast. Ask a local surf shop or your hotel front desk the evening before, and look at the water before you go in.
How busy is Sayulita in September? Crowds and prices
We found no occupancy series and no monthly room-rate series for Sayulita, so we crown no month expensive or cheap. What we can read is SECTUR’s calendar: Festival Sayulita on January 30-February 3, a shore fishing tournament on May 25-26, Dia de Muertos on November 1-2, the Surf Open Sayulita on November 22 and the Fiestas Patronales on December 1-12. September has no entry, and some feast dates slide from year to year.
We also found no booking-lead data, so we give no number of weeks. What we did read: the U.S. State Department rates Nayarit at Level 2, ‘Exercise increased caution’ (consulted September 29, 2026). Read that advisory and SMN’s forecast before any non-refundable payment, and favor rates you can cancel.
Nayarit’s lodging tax, the Impuesto Sobre Hospedaje, is set at 5% under Article 62 of the state’s Ley de Hacienda, and the 2026 Ley de Ingresos confirms it. We could not verify how each property shows it, so ask whether a quoted rate already includes it before you compare two hotels.
The one line where paying more changes September is the room itself. With highs of 94.3°F and lows of 73.6°F, working air conditioning and a covered terrace or balcony where wet clothes can dry are worth more than a view.
Things to do in Sayulita in September
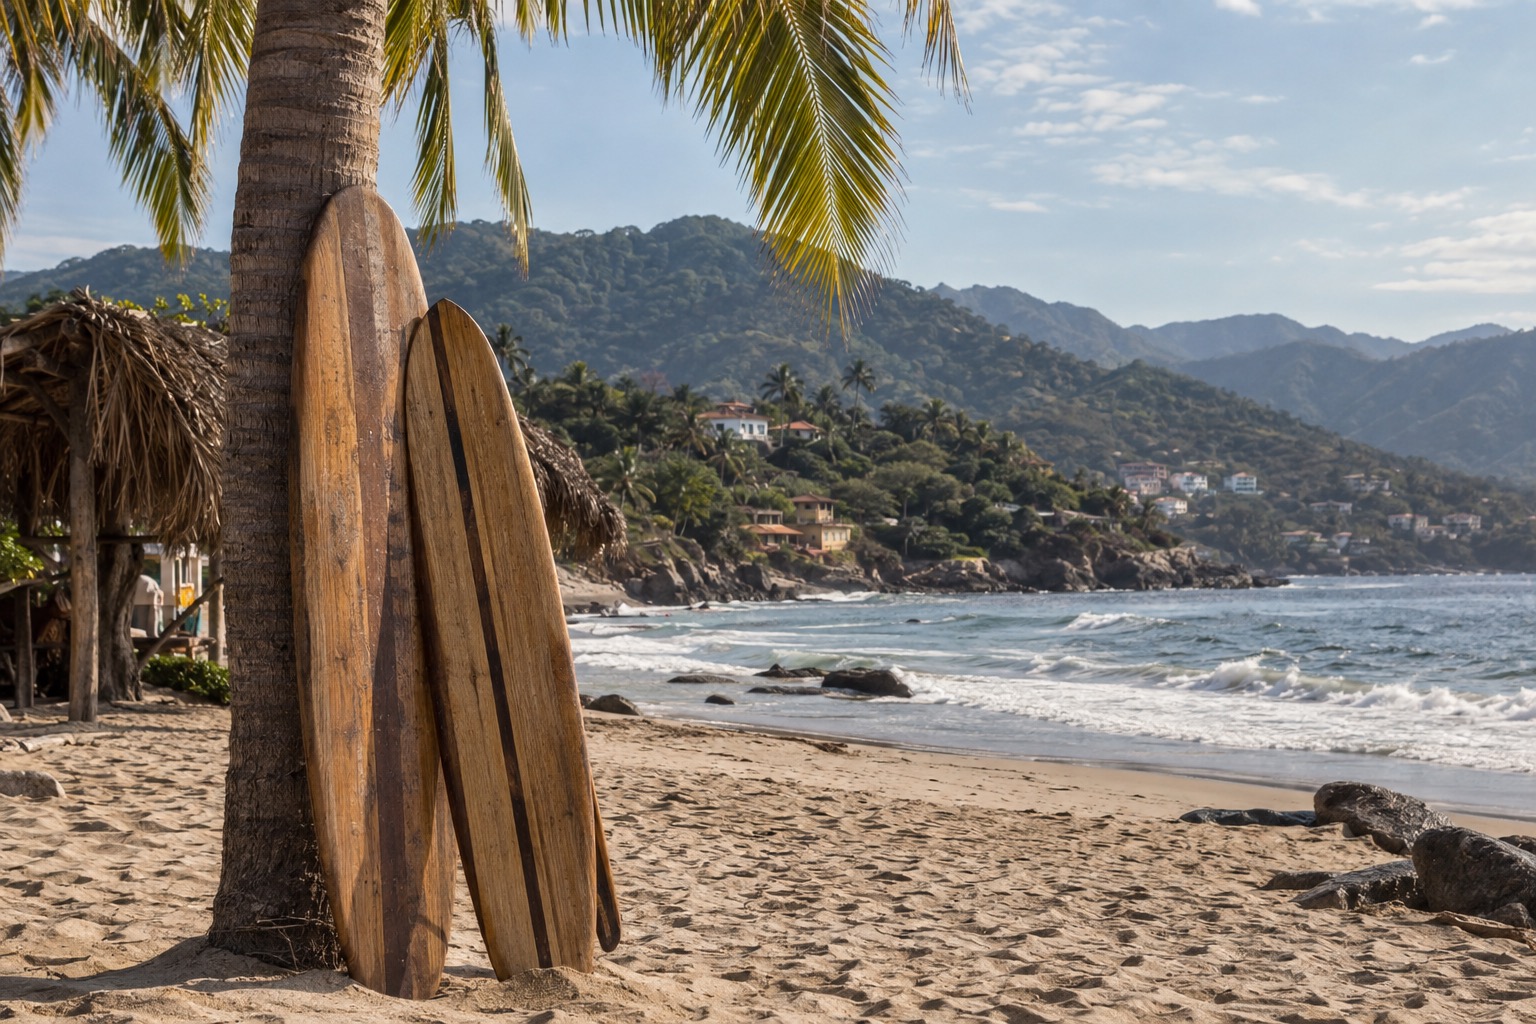
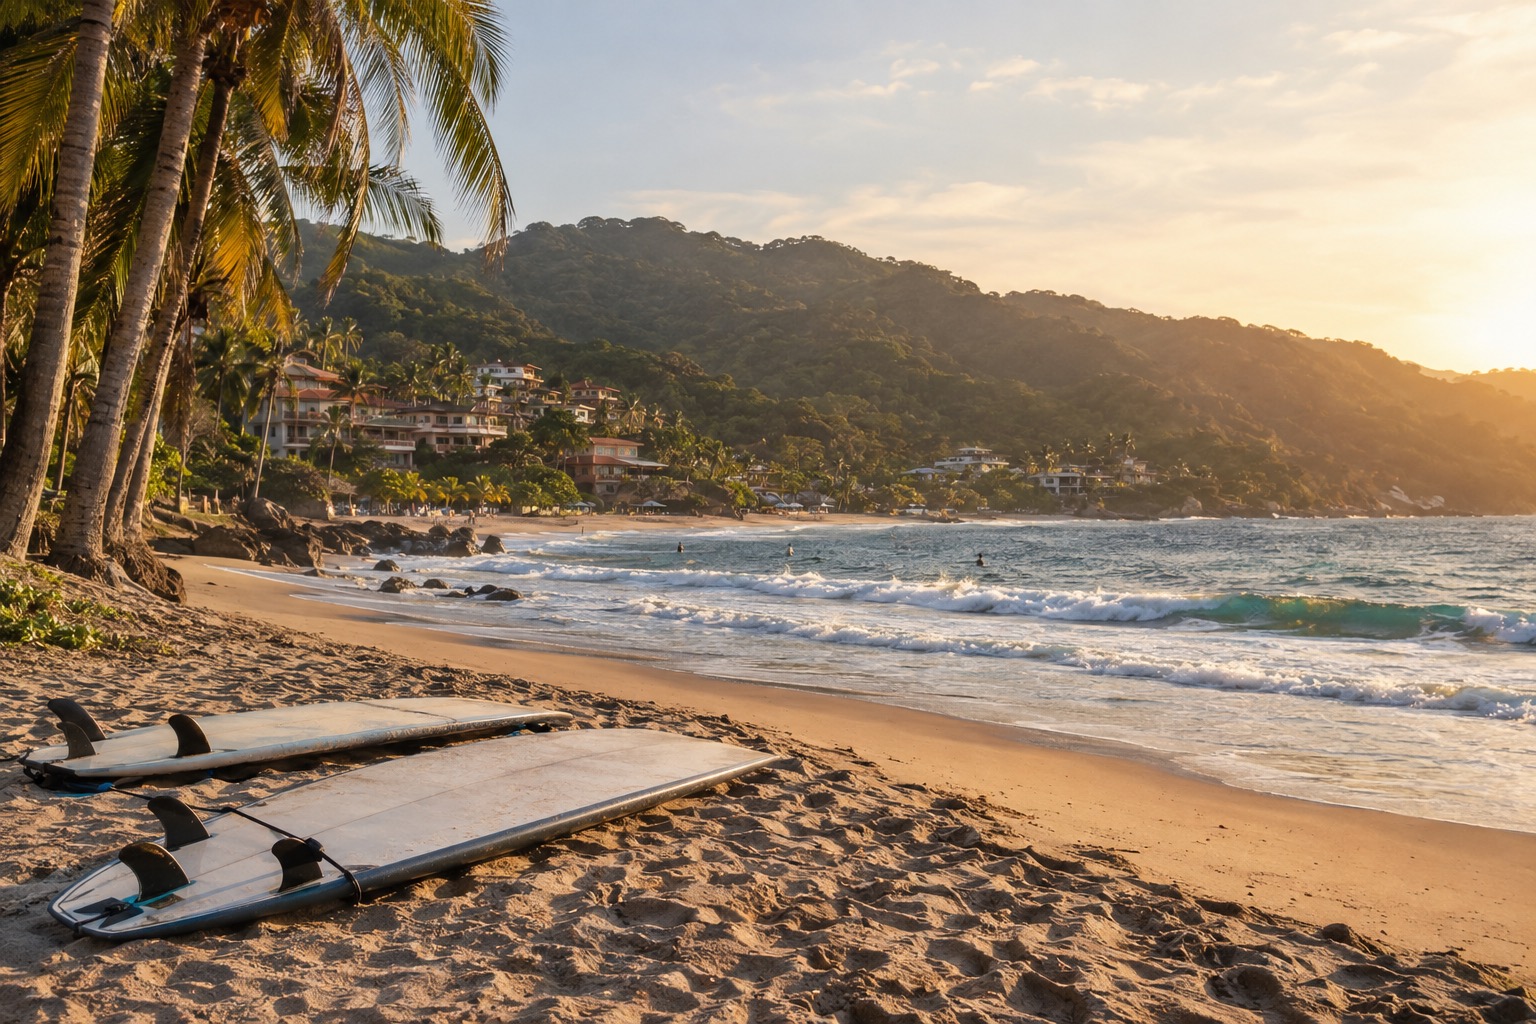
September belongs to the water. A sea at 89.0°F suits a full morning on a board or a slow swim, and with rain on most days, a wet swimsuit is the normal state of things. Nothing on SECTUR’s calendar competes for your time, so the days are yours to shuffle around the weather.
Islas Marietas National Park sits on the same stretch of coast as the boat departures. Its Playa del Amor charges a 125-peso CONANP entrance fee and opens Wednesday through Sunday, 8:00 a.m. to 5:00 p.m. We found no boat fares or departure times, so get those from an operator. SECTUR also lists the Campamento Tortuguero Sayulita, a sea-turtle camp, among the town’s official attractions. We could not verify its September schedule, so ask before you plan around it.
Surf is the anchor. The town beach is a well-known beginner-friendly break, while the point break and river-mouth beaches nearby draw more experienced surfers. September’s air is the part that wears on you at 94.3°F, so book lessons and paddle-outs for the hours nearest sunrise, and leave midday for shade.
We could not verify which beaches, viewpoints or events are free in September, so we name none as free. Entry to Playa del Amor is the only fee we can price.
Sayulita itinerary for September
Day one starts with first light, since the sun rises at 6:47 a.m. Walk the town beach while the air is still gentle, then take a beginner surf lesson on the town break. Retreat indoors for a long lunch when the heat peaks toward the 94.3°F average high, swim again in the late afternoon, and finish with sunset at 7:05 p.m. Dinner is in the dark.
Day two is the Islas Marietas day, and it has to fall on a Wednesday through Sunday, when Playa del Amor is open from 8:00 a.m. to 5:00 p.m. Keep it flexible until the morning of, since rain is likely on most September days. If the weather turns or the day lands on a Monday or Tuesday, swap in a second surf session, a long lunch or a visit to the turtle camp after asking about its hours.
Sayulita in September vs August and October
| Measure | August | September | October |
|---|---|---|---|
| Average high | 94.8°F | 94.3°F | 95.2°F |
| Average low | 73.4°F | 73.6°F | 72.0°F |
| Precipitation | 16.18 inches | 16.67 inches | 7.20 inches |
| Days of measurable rain | 23.5 | 22.1 | 11.8 |
| Sea surface (marine API, daily maxima) | 88.8°F | 89.0°F | 87.6°F |
Air temperatures barely move across the three months: highs stay within 0.9 degrees of each other and lows within 1.6 degrees, using the SMN 1991-2020 normals. The sea follows suit at 88.8°F, 89.0°F and 87.6°F on the marine API’s 2015-2024 average. Rain is where the months split. August and September are almost twins at 16.18 and 16.67 inches, with 23.5 and 22.1 rain days. October drops to 7.20 inches and 11.8 days.
Moving a month later to October takes 9.47 inches of precipitation and 10.3 rain days out of the picture. It costs a sea that is 1.4 degrees cooler, and nights 1.6 degrees cooler than September’s, which nobody will feel. Moving back to August gains nothing, since it has more rain days than September. Push past October and SECTUR’s calendar fills with Dia de Muertos on November 1-2 and the Surf Open Sayulita on November 22.
Is September a good time to visit Sayulita?
Yes, if you want warm water, flexible days and a town with no festival to plan around, and you can live with measurable rain on about three days out of four. No, if you need a dry-beach week or a set of fixed outdoor plans, because the 22.1 rain days are an average and any given year can lean either way.
If the answer is no, book October. It is the same town and the same gateways, Puerto Vallarta International or Tepic (TPQ), and 7.20 inches of precipitation against September’s 16.67. Wait until November if a festival is what you came for.
September’s own gift is the water: 89.0°F on the marine API’s daily maxima, warmer than August’s 88.8°F and October’s 87.6°F, with no scheduled crowd to share it.
The last word
Choose September for the sea and October for drier days. SECTUR puts Sayulita’s yearly average at about 77°F (25°C), so a September night at 73.6°F sits 3.4 degrees under it and needs no sweater, while a 94.3°F afternoon needs a hat and a plan for shade. Whichever month you pick, keep a Wednesday to Sunday free for Playa del Amor, and call the turtle camp for its own hours before you build a day around it.
Sources & data for this guide
- Air temperature, precipitation and rain days · Servicio Meteorologico Nacional (CONAGUA), 1991-2020 normals, station 18021 (Las Gaviotas, Bahía de Banderas) · checked Sep 30, 2026 · SMN does not publish its rain-day threshold
- Sea surface temperature · Open-Meteo Marine API, mean of daily maxima 2015-2024 · checked Sep 30, 2026
- Daylight, sunrise and sunset, September 15 · sunrise-sunset.org · checked Sep 30, 2026
- Pueblo Mágico status, event calendar, turtle camp, air gateways and annual average · SECTUR, gob.mx, page ‘Sayulita, Nayarit’ · checked Sep 30, 2026
- Lodging tax · Ley de Hacienda del Estado de Nayarit, Article 62, and Ley de Ingresos 2026 · checked Sep 30, 2026
- Playa del Amor fee and hours · CONANP, Islas Marietas · checked Sep 30, 2026
- Travel advisory · U.S. Department of State, Mexico Travel Advisory · checked Sep 30, 2026
- We found no occupancy series, no room-rate series, no boat fares, no swell or wind data and no turtle-camp schedule, and the surf description is common knowledge. Hours, fees and event dates change · check operators when you book.